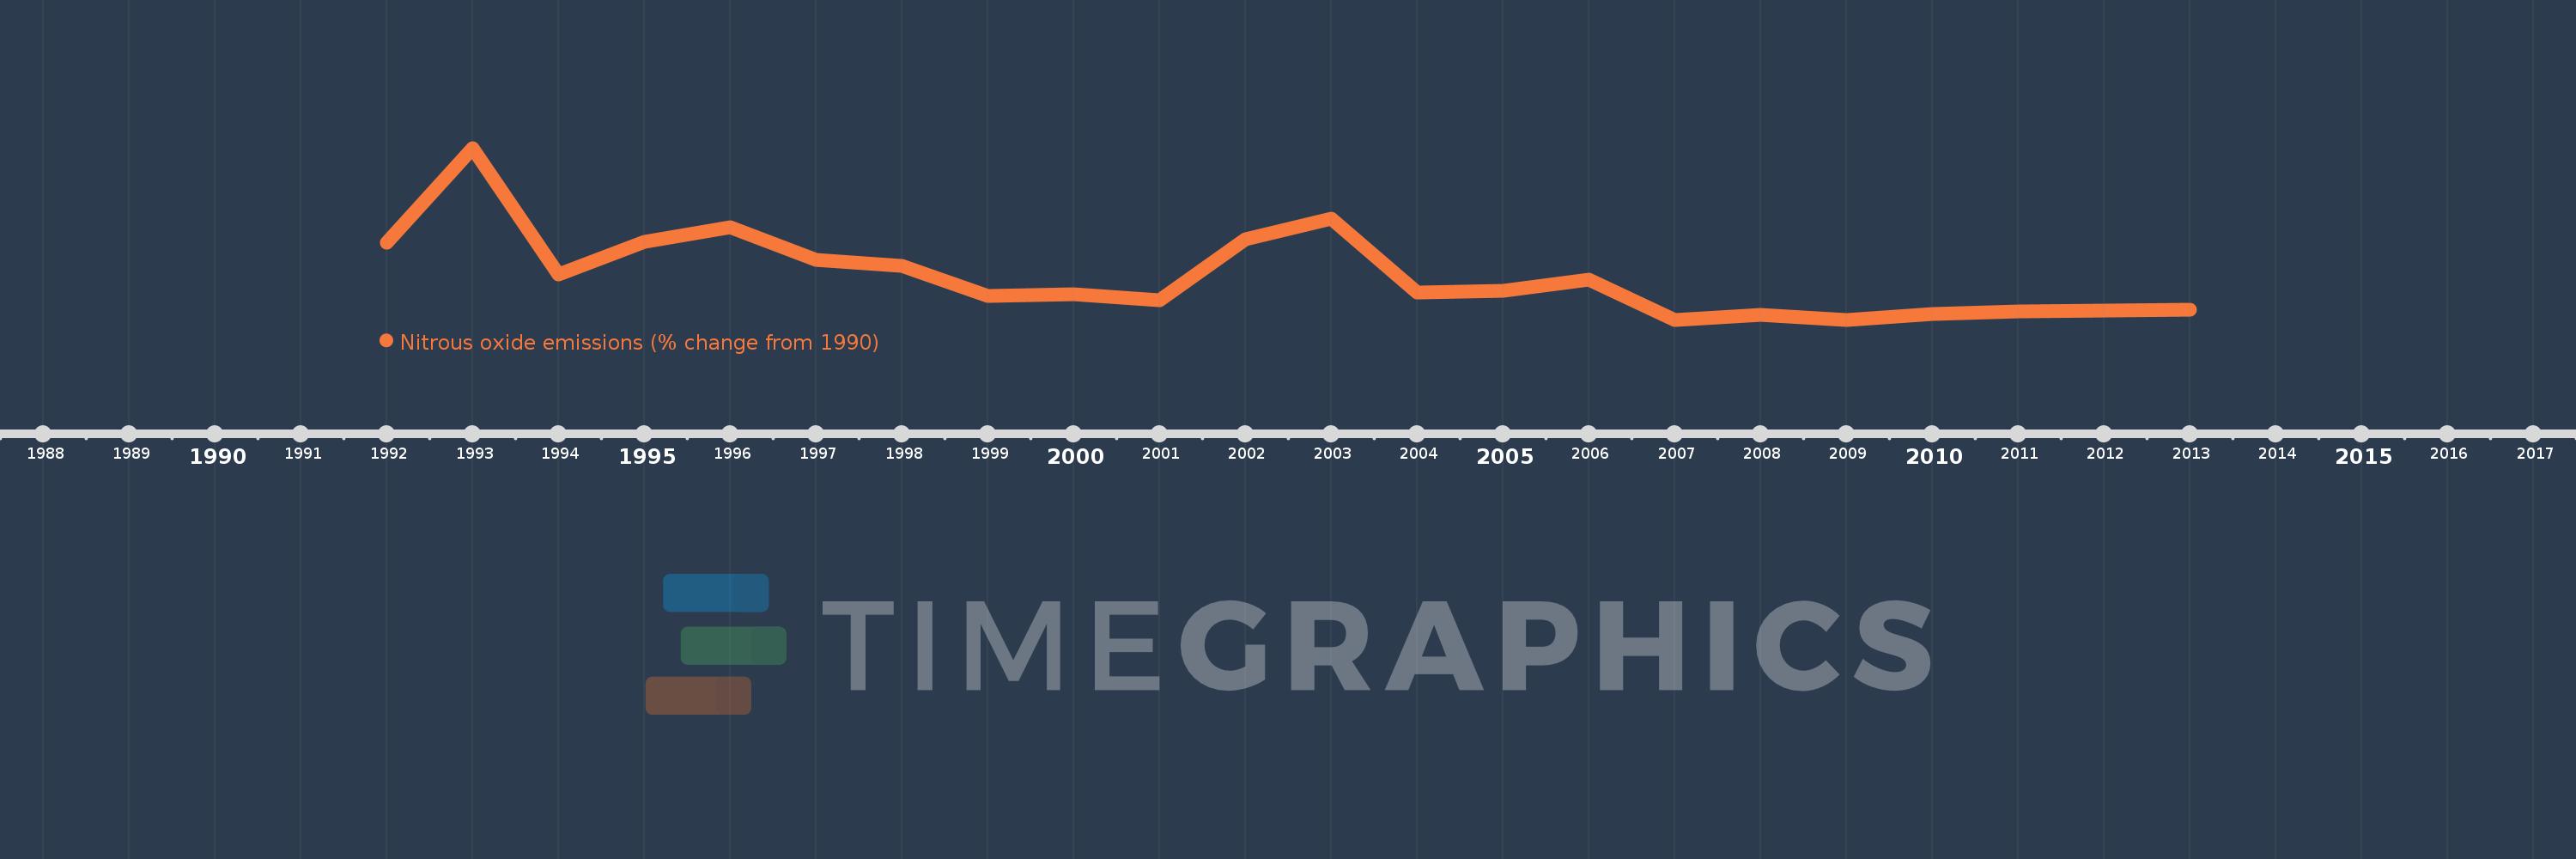
This timeline shows a graph from 1992 to 2013 of Botswana. No data until 1991. Number of actual observations by date: 22.
Source name:
World Development Indicators
Source organization:
World Bank staff estimates from original source: European Commission, Joint Research Centre (JRC)/Netherlands Environmental Assessment Agency (PBL). Emission Database for Global Atmospheric Research (EDGAR): http://edgar.jrc.ec.europa.eu/.
Categories, topics:
Climate Change, Environment
Last updated:
apr 23, 2017
Indicators value changes by year
Meaning:
-41.155
Minimum:
-63.759
jan 1, 2009
Maximum:
24.993
jan 1, 1993
At the date of observation
Value
Absolute change
Change from the previous value
jan 1, 1992
-23.846
-23.846
0.0%
jan 1, 1993
24.993
+48.838
-204.81%
jan 1, 1994
-40.345
-65.338
-261.43%
jan 1, 1995
-23.681
+16.665
-41.3%
jan 1, 1996
-15.763
+7.918
-33.44%
jan 1, 1997
-32.682
-16.919
107.34%
jan 1, 1998
-35.945
-3.262
9.98%
jan 1, 1999
-51.289
-15.345
42.69%
jan 1, 2000
-50.692
+0.597
-1.16%
jan 1, 2001
-53.71
-3.018
5.95%
jan 1, 2002
-22.191
+31.52
-58.68%
jan 1, 2003
-11.604
+10.586
-47.71%
jan 1, 2004
-49.765
-38.161
328.86%
jan 1, 2005
-48.698
+1.067
-2.14%
jan 1, 2006
-43.24
+5.458
-11.21%
jan 1, 2007
-63.748
-20.508
47.43%
jan 1, 2008
-61.412
+2.336
-3.66%
jan 1, 2009
-63.759
-2.347
3.82%
jan 1, 2010
-60.754
+3.005
-4.71%
jan 1, 2011
-59.498
+1.256
-2.07%
jan 1, 2012
-59.093
+0.405
-0.68%
jan 1, 2013
-58.688
+0.405
-0.69%
Ranking of countries by current statistics by years