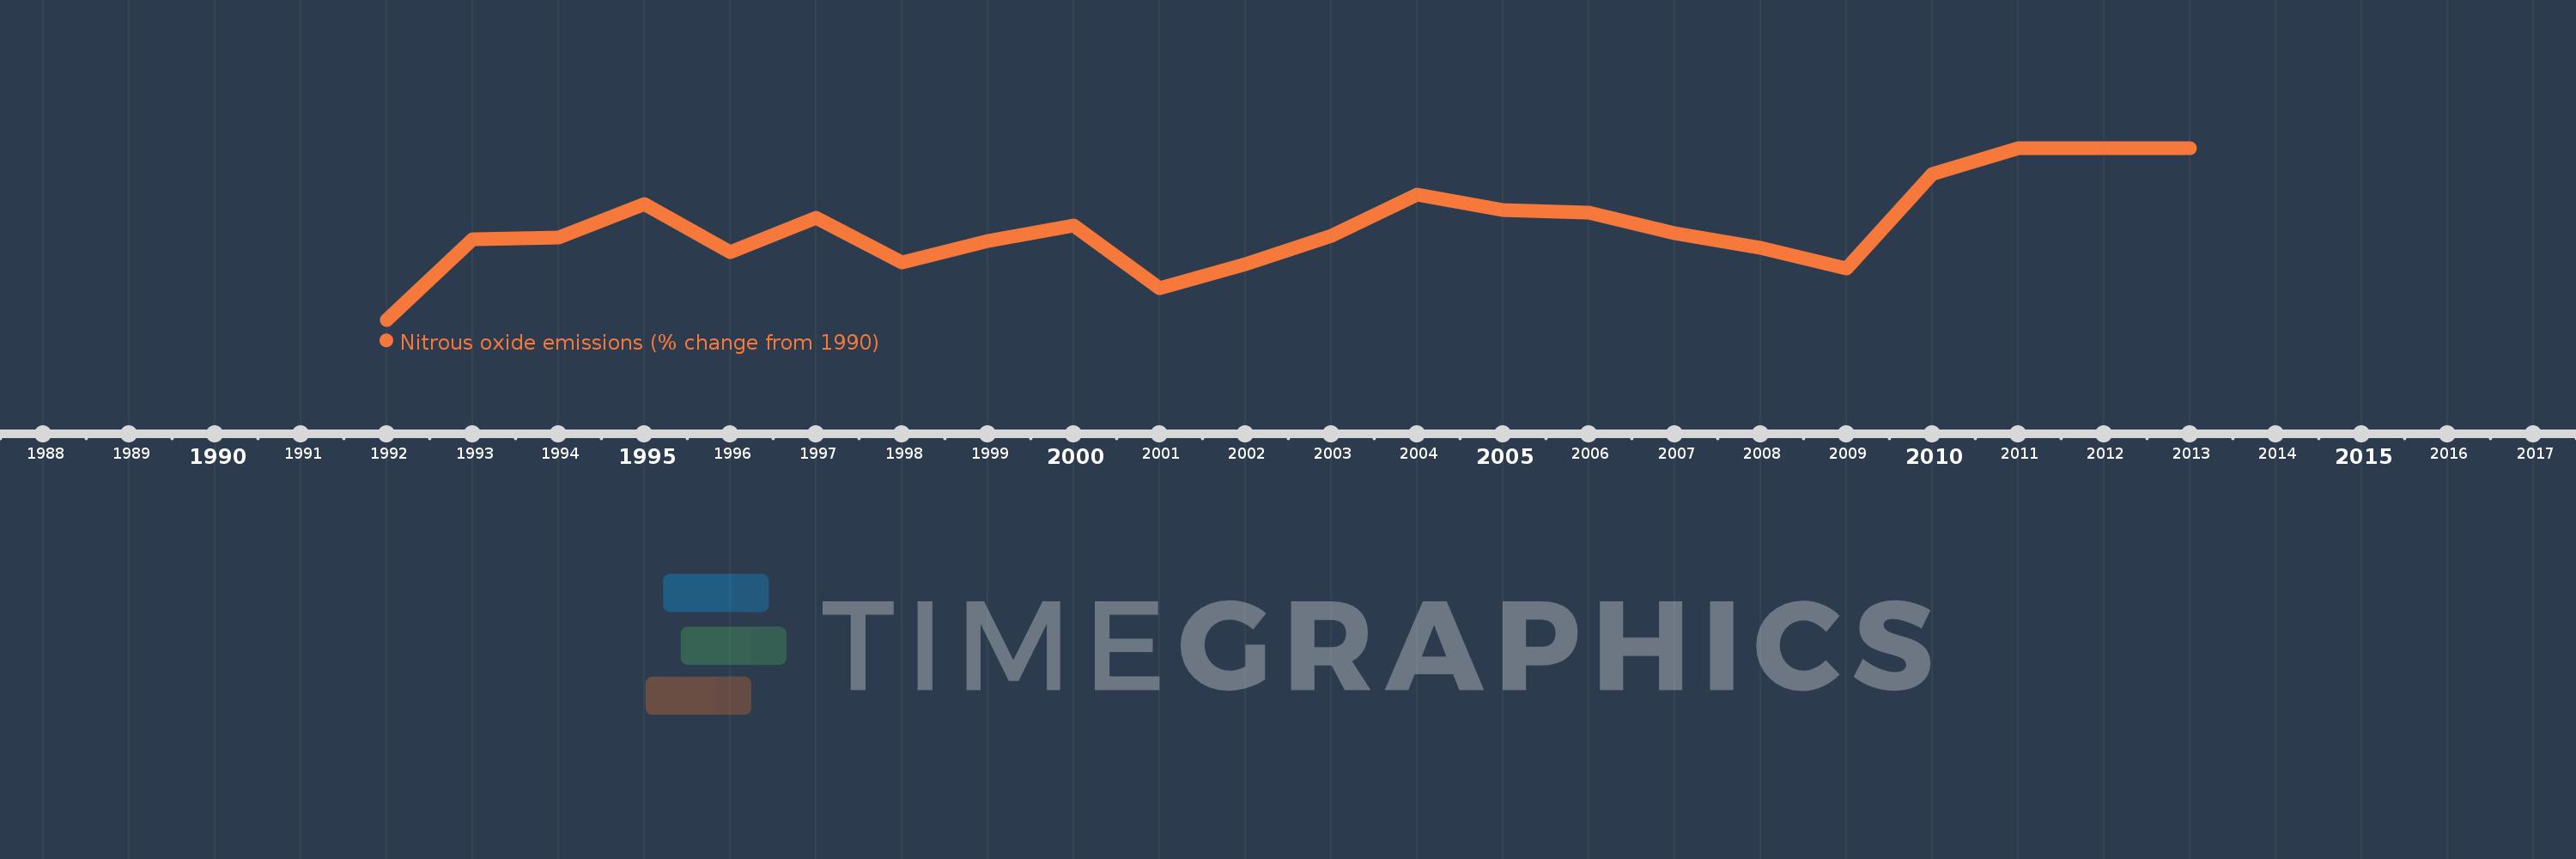
This timeline shows a graph from 1992 to 2013 of Cyprus. No data until 1991. Number of actual observations by date: 22.
Source name:
World Development Indicators
Source organization:
World Bank staff estimates from original source: European Commission, Joint Research Centre (JRC)/Netherlands Environmental Assessment Agency (PBL). Emission Database for Global Atmospheric Research (EDGAR): http://edgar.jrc.ec.europa.eu/.
Categories, topics:
Climate Change, Environment
Last updated:
apr 23, 2017
Indicators value changes by year
Meaning:
17.526
Minimum:
1.151
jan 1, 1992
Maximum:
31.159
jan 1, 2011
At the date of observation
Value
Absolute change
Change from the previous value
jan 1, 1992
1.151
+1.151
0.0%
jan 1, 1993
15.281
+14.13
1.23K%
jan 1, 1994
15.513
+0.232
1.52%
jan 1, 1995
21.304
+5.791
37.33%
jan 1, 1996
13.01
-8.294
-38.93%
jan 1, 1997
18.969
+5.959
45.81%
jan 1, 1998
11.129
-7.84
-41.33%
jan 1, 1999
14.95
+3.821
34.33%
jan 1, 2000
17.683
+2.734
18.29%
jan 1, 2001
6.664
-11.019
-62.31%
jan 1, 2002
10.894
+4.229
63.46%
jan 1, 2003
15.864
+4.97
45.63%
jan 1, 2004
23.065
+7.201
45.39%
jan 1, 2005
20.357
-2.708
-11.74%
jan 1, 2006
19.802
-0.555
-2.73%
jan 1, 2007
16.225
-3.578
-18.07%
jan 1, 2008
13.648
-2.577
-15.88%
jan 1, 2009
10.093
-3.555
-26.05%
jan 1, 2010
26.608
+16.515
163.62%
jan 1, 2011
31.159
+4.551
17.1%
jan 1, 2012
31.12
-0.038
-0.12%
jan 1, 2013
31.082
-0.038
-0.12%
Ranking of countries by current statistics by years