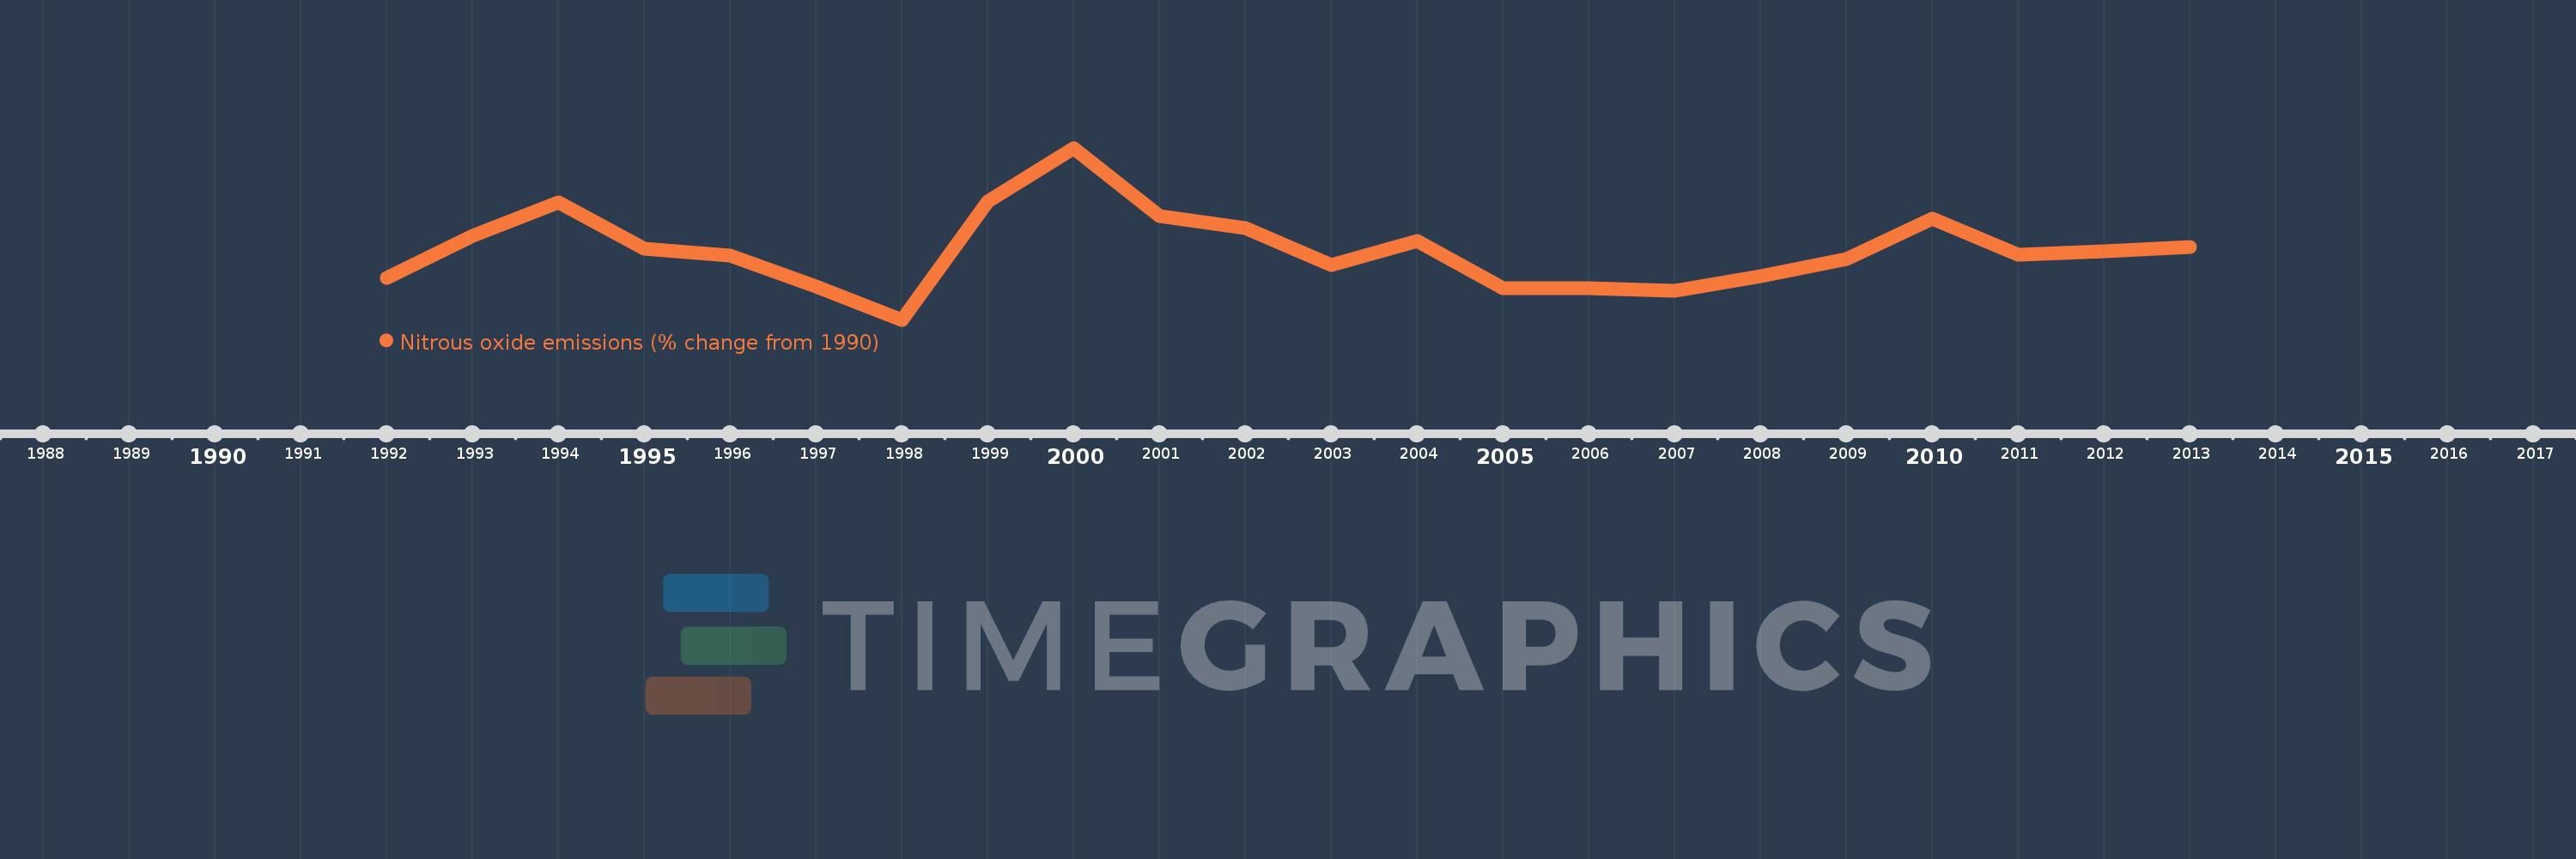
This timeline shows a graph from 1992 to 2013 of Hong Kong SAR, China. No data until 1991. Number of actual observations by date: 22.
Source name:
World Development Indicators
Source organization:
World Bank staff estimates from original source: European Commission, Joint Research Centre (JRC)/Netherlands Environmental Assessment Agency (PBL). Emission Database for Global Atmospheric Research (EDGAR): http://edgar.jrc.ec.europa.eu/.
Categories, topics:
Climate Change, Environment
Last updated:
apr 23, 2017
Indicators value changes by year
Meaning:
19.207
Minimum:
-1.583
jan 1, 1998
Maximum:
49.679
jan 1, 2000
At the date of observation
Value
Absolute change
Change from the previous value
jan 1, 1992
10.927
+10.927
0.0%
jan 1, 1993
23.585
+12.658
115.85%
jan 1, 1994
33.443
+9.858
41.8%
jan 1, 1995
19.521
-13.922
-41.63%
jan 1, 1996
17.501
-2.019
-10.34%
jan 1, 1997
8.229
-9.272
-52.98%
jan 1, 1998
-1.583
-9.813
-119.24%
jan 1, 1999
33.805
+35.388
-2.24K%
jan 1, 2000
49.679
+15.874
46.96%
jan 1, 2001
29.33
-20.349
-40.96%
jan 1, 2002
25.668
-3.662
-12.49%
jan 1, 2003
14.775
-10.893
-42.44%
jan 1, 2004
22.013
+7.238
48.99%
jan 1, 2005
7.755
-14.258
-64.77%
jan 1, 2006
7.832
+0.077
0.99%
jan 1, 2007
7.019
-0.812
-10.37%
jan 1, 2008
11.341
+4.321
61.56%
jan 1, 2009
16.533
+5.193
45.79%
jan 1, 2010
28.536
+12.002
72.59%
jan 1, 2011
17.703
-10.833
-37.96%
jan 1, 2012
18.88
+1.177
6.65%
jan 1, 2013
20.057
+1.177
6.23%
Ranking of countries by current statistics by years