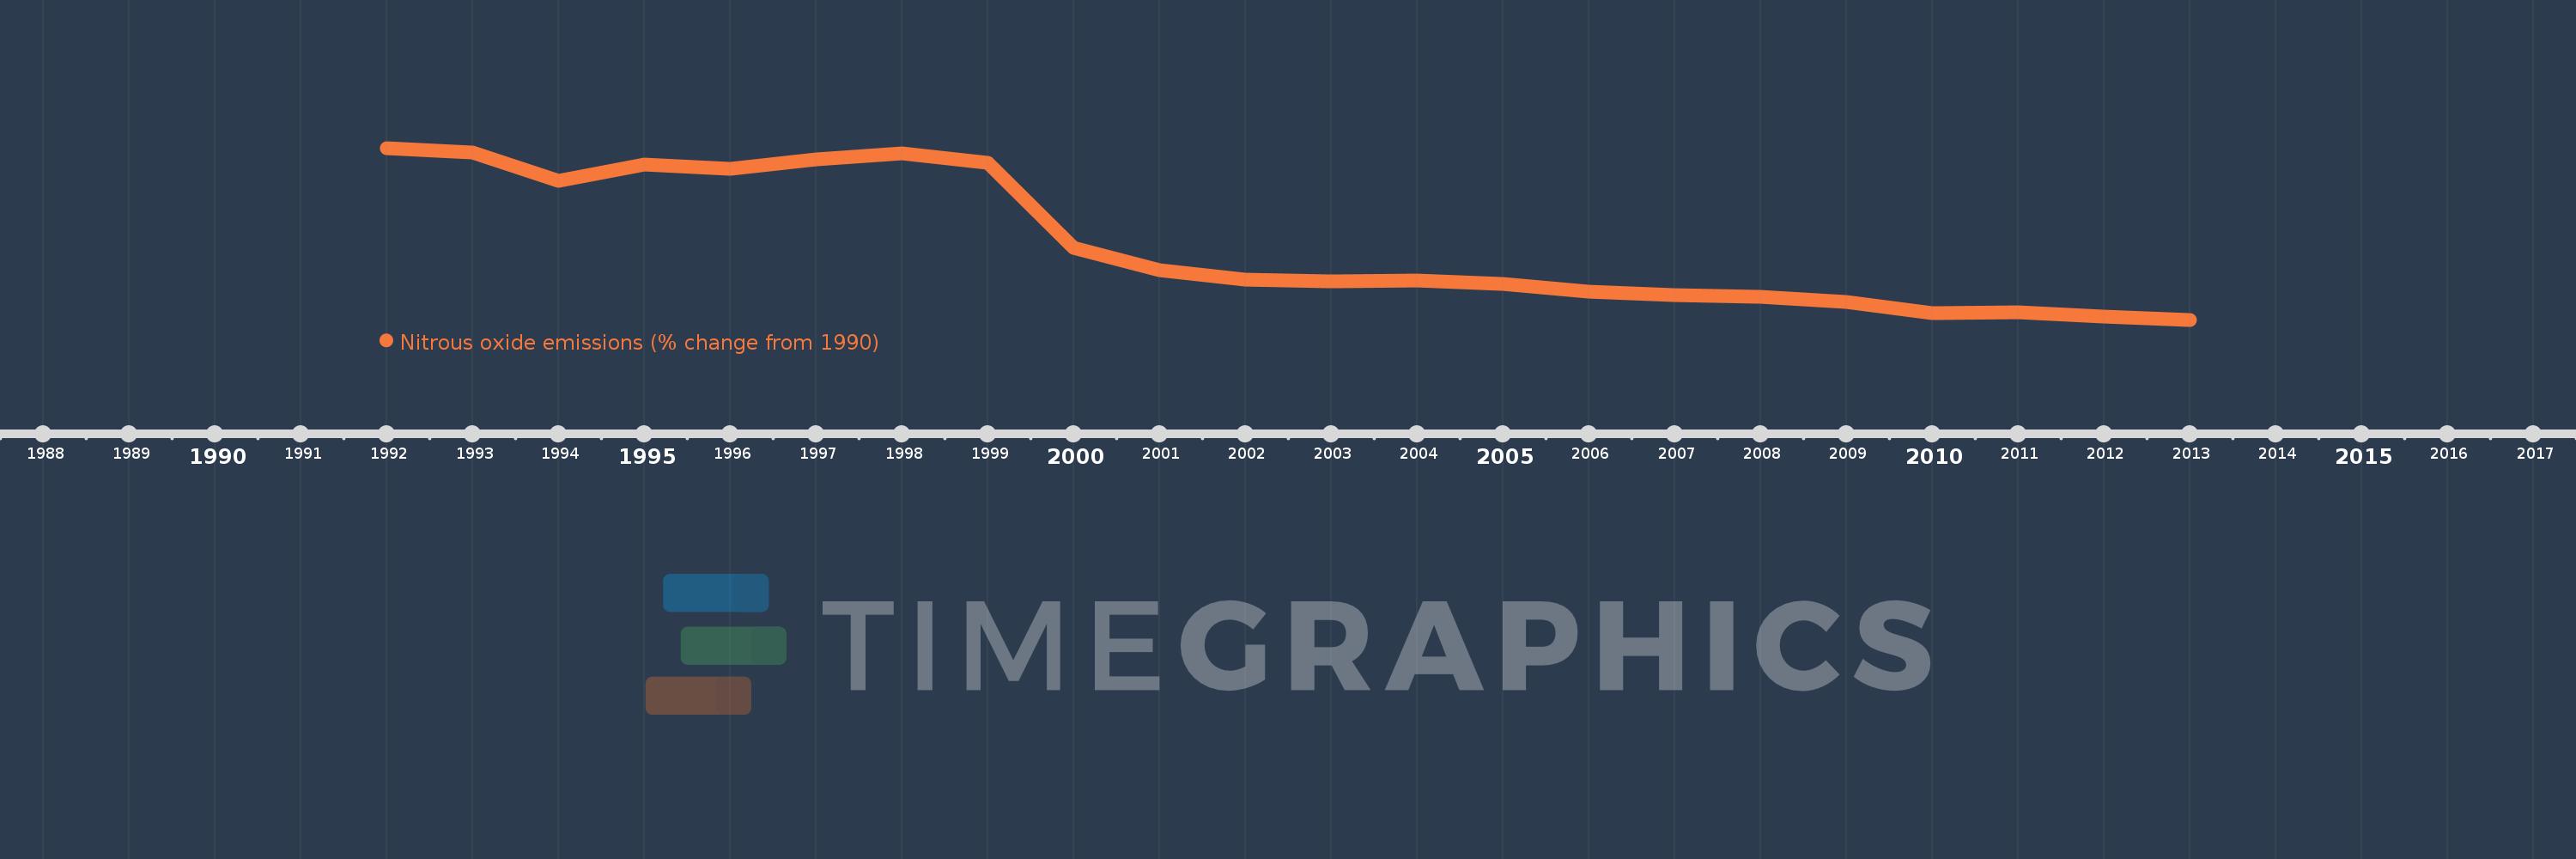
This timeline shows a graph from 1992 to 2013 of United Kingdom. No data until 1991. Number of actual observations by date: 22.
Source name:
World Development Indicators
Source organization:
World Bank staff estimates from original source: European Commission, Joint Research Centre (JRC)/Netherlands Environmental Assessment Agency (PBL). Emission Database for Global Atmospheric Research (EDGAR): http://edgar.jrc.ec.europa.eu/.
Categories, topics:
Climate Change, Environment
Last updated:
apr 23, 2017
Indicators value changes by year
Meaning:
-32.831
Minimum:
-55.354
jan 1, 2013
Maximum:
-3.905
jan 1, 1992
At the date of observation
Value
Absolute change
Change from the previous value
jan 1, 1992
-3.905
-3.905
0.0%
jan 1, 1993
-5.23
-1.325
33.93%
jan 1, 1994
-13.639
-8.41
160.81%
jan 1, 1995
-8.909
+4.73
-34.68%
jan 1, 1996
-10.103
-1.194
13.4%
jan 1, 1997
-7.272
+2.831
-28.03%
jan 1, 1998
-5.602
+1.669
-22.96%
jan 1, 1999
-8.457
-2.855
50.96%
jan 1, 2000
-33.804
-25.347
299.71%
jan 1, 2001
-40.454
-6.651
19.67%
jan 1, 2002
-43.251
-2.796
6.91%
jan 1, 2003
-43.816
-0.565
1.31%
jan 1, 2004
-43.572
+0.244
-0.56%
jan 1, 2005
-44.539
-0.967
2.22%
jan 1, 2006
-46.906
-2.367
5.32%
jan 1, 2007
-47.914
-1.008
2.15%
jan 1, 2008
-48.53
-0.616
1.29%
jan 1, 2009
-49.948
-1.418
2.92%
jan 1, 2010
-53.439
-3.491
6.99%
jan 1, 2011
-53.237
+0.202
-0.38%
jan 1, 2012
-54.396
-1.159
2.18%
jan 1, 2013
-55.354
-0.958
1.76%
Ranking of countries by current statistics by years