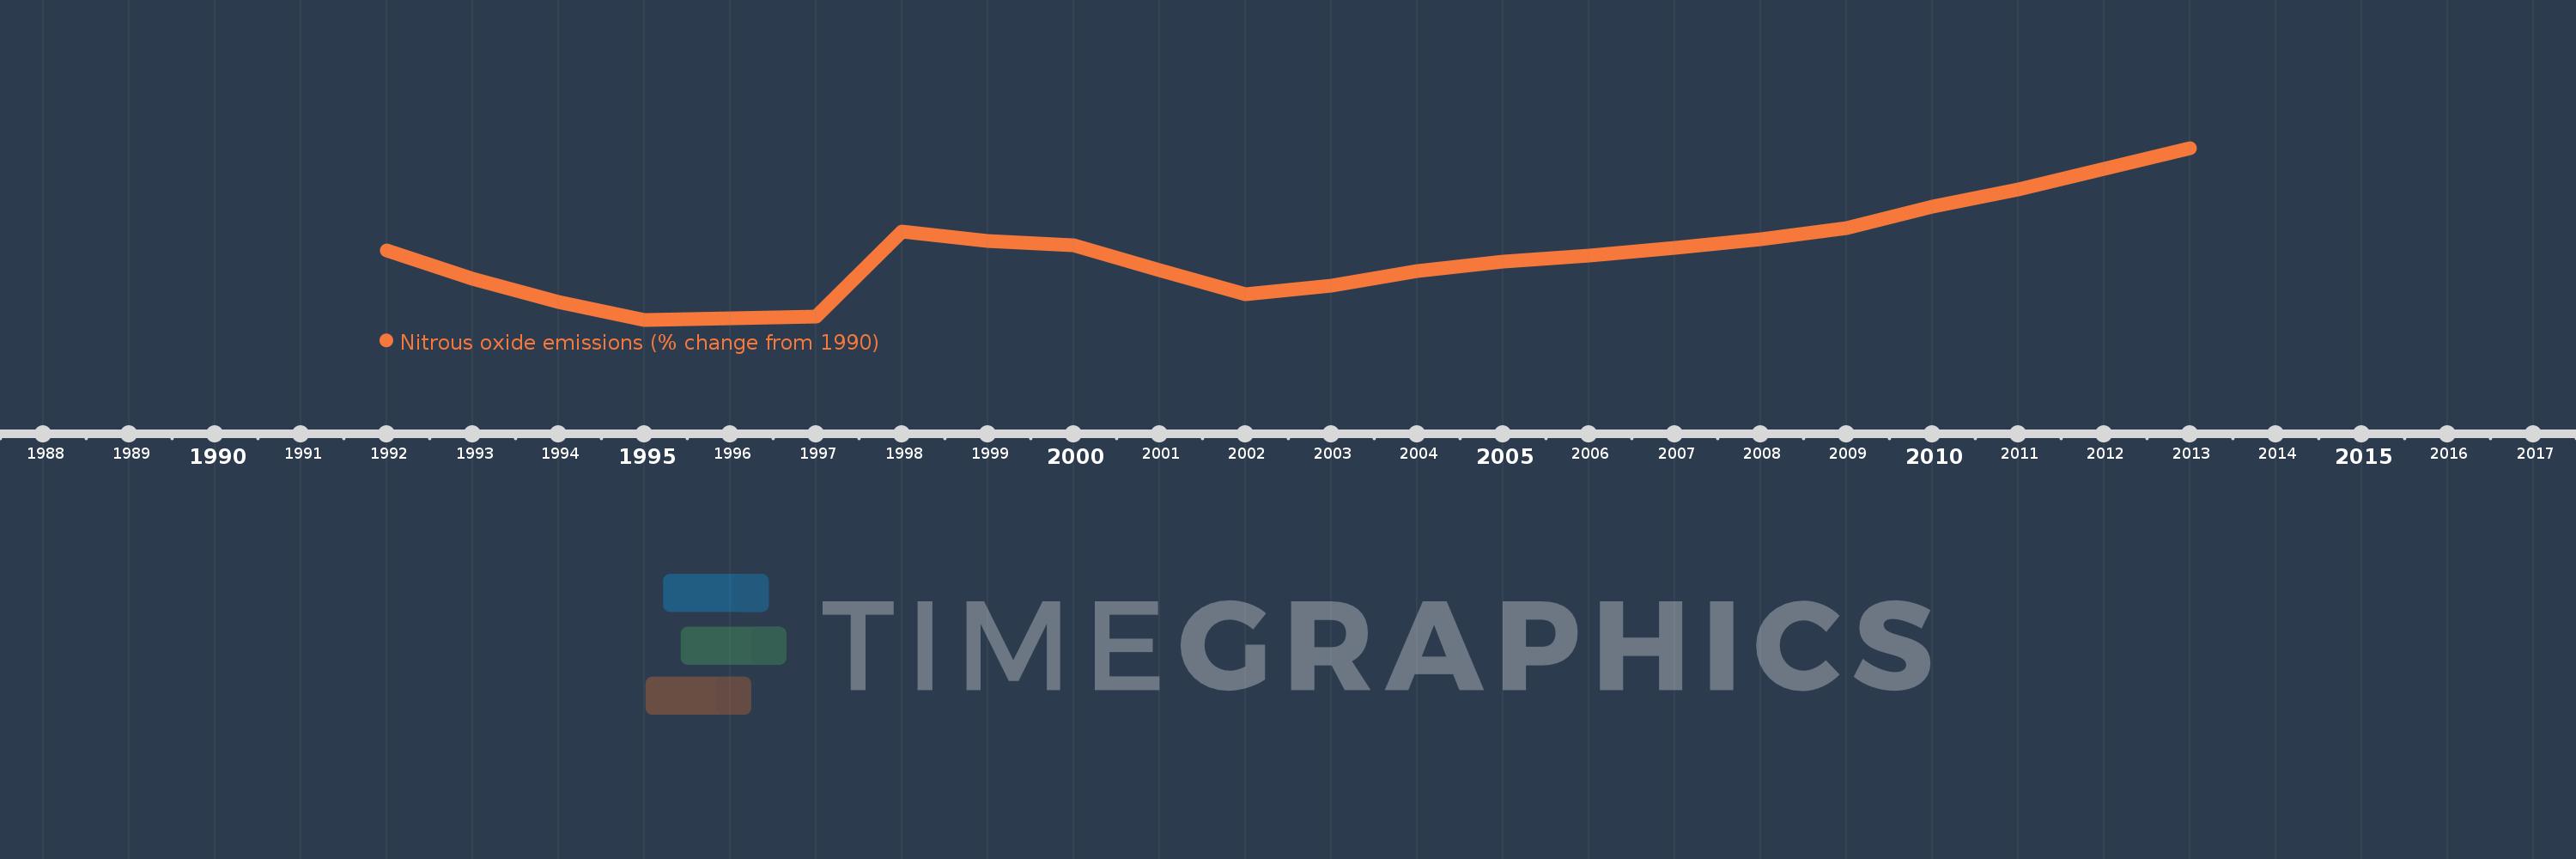
This timeline shows a graph from 1992 to 2013 of Uzbekistan. No data until 1991. Number of actual observations by date: 22.
Source name:
World Development Indicators
Source organization:
World Bank staff estimates from original source: European Commission, Joint Research Centre (JRC)/Netherlands Environmental Assessment Agency (PBL). Emission Database for Global Atmospheric Research (EDGAR): http://edgar.jrc.ec.europa.eu/.
Categories, topics:
Climate Change, Environment
Last updated:
apr 23, 2017
Indicators value changes by year
Meaning:
-9.704
Minimum:
-27.216
jan 1, 1995
Maximum:
17.949
jan 1, 2013
At the date of observation
Value
Absolute change
Change from the previous value
jan 1, 1992
-8.909
-8.909
0.0%
jan 1, 1993
-16.444
-7.535
84.58%
jan 1, 1994
-22.515
-6.071
36.92%
jan 1, 1995
-27.216
-4.701
20.88%
jan 1, 1996
-26.735
+0.481
-1.77%
jan 1, 1997
-26.492
+0.244
-0.91%
jan 1, 1998
-3.994
+22.497
-84.92%
jan 1, 1999
-6.482
-2.488
62.29%
jan 1, 2000
-7.582
-1.1
16.97%
jan 1, 2001
-14.075
-6.492
85.63%
jan 1, 2002
-20.6
-6.526
46.36%
jan 1, 2003
-18.158
+2.442
-11.85%
jan 1, 2004
-14.375
+3.783
-20.84%
jan 1, 2005
-12.024
+2.351
-16.36%
jan 1, 2006
-10.447
+1.577
-13.11%
jan 1, 2007
-8.358
+2.089
-19.99%
jan 1, 2008
-5.944
+2.414
-28.89%
jan 1, 2009
-3.134
+2.81
-47.28%
jan 1, 2010
2.571
+5.705
-182.06%
jan 1, 2011
6.993
+4.422
171.97%
jan 1, 2012
12.471
+5.478
78.32%
jan 1, 2013
17.949
+5.478
43.92%
Ranking of countries by current statistics by years