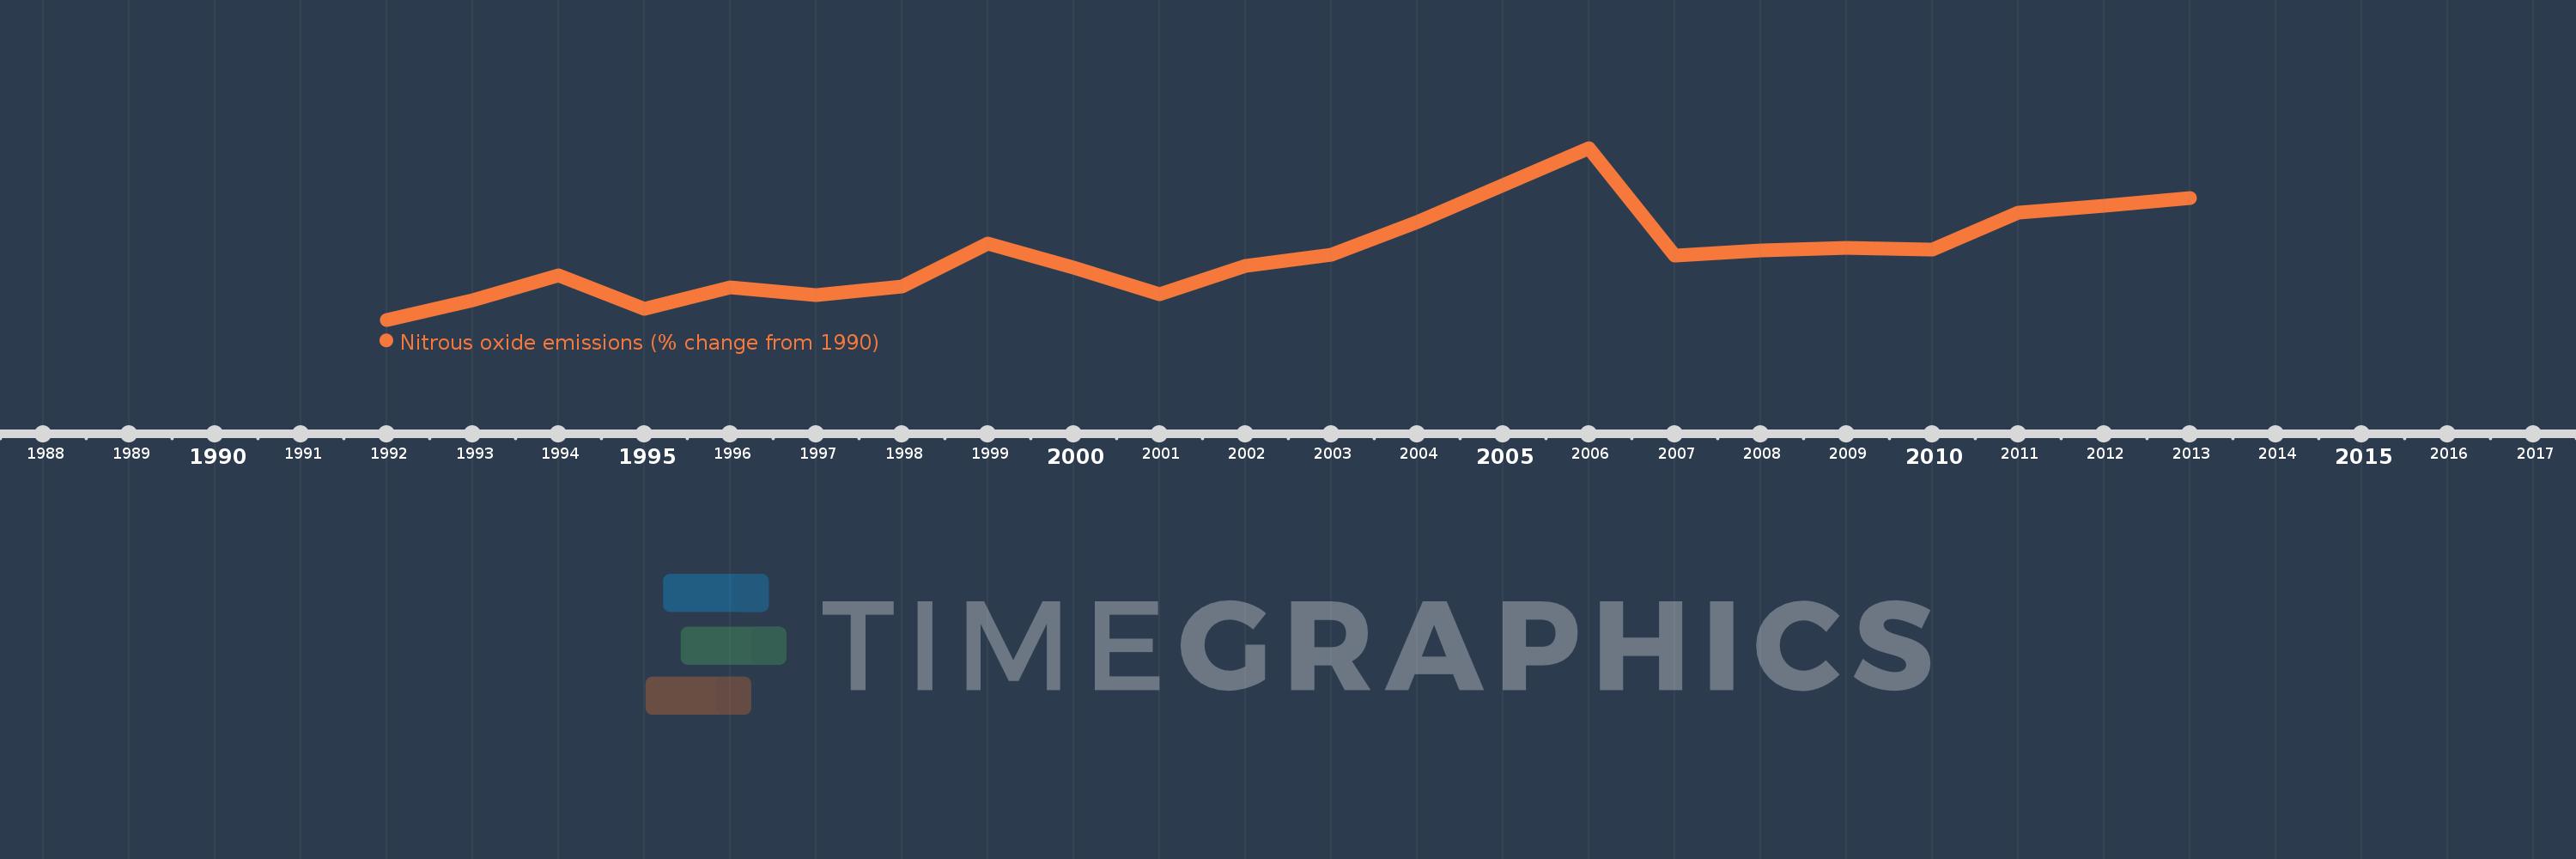
This timeline shows a graph from 1992 to 2013 of Brazil. No data until 1991. Number of actual observations by date: 22.
Source name:
World Development Indicators
Source organization:
World Bank staff estimates from original source: European Commission, Joint Research Centre (JRC)/Netherlands Environmental Assessment Agency (PBL). Emission Database for Global Atmospheric Research (EDGAR): http://edgar.jrc.ec.europa.eu/.
Categories, topics:
Climate Change, Environment
Last updated:
apr 23, 2017
Indicators value changes by year
Meaning:
20.104
Minimum:
0.026
jan 1, 1992
Maximum:
51.976
jan 1, 2006
At the date of observation
Value
Absolute change
Change from the previous value
jan 1, 1992
0.026
+0.026
0.0%
jan 1, 1993
5.937
+5.911
22.48K%
jan 1, 1994
13.388
+7.45
125.48%
jan 1, 1995
3.338
-10.049
-75.06%
jan 1, 1996
9.786
+6.448
193.15%
jan 1, 1997
7.395
-2.391
-24.43%
jan 1, 1998
10.146
+2.751
37.2%
jan 1, 1999
23.145
+12.999
128.12%
jan 1, 2000
15.746
-7.398
-31.97%
jan 1, 2001
7.683
-8.064
-51.21%
jan 1, 2002
16.34
+8.657
112.68%
jan 1, 2003
19.702
+3.362
20.57%
jan 1, 2004
29.509
+9.808
49.78%
jan 1, 2005
40.836
+11.326
38.38%
jan 1, 2006
51.976
+11.141
27.28%
jan 1, 2007
19.401
-32.575
-62.67%
jan 1, 2008
20.971
+1.57
8.09%
jan 1, 2009
21.765
+0.794
3.79%
jan 1, 2010
21.362
-0.403
-1.85%
jan 1, 2011
32.425
+11.063
51.79%
jan 1, 2012
34.61
+2.185
6.74%
jan 1, 2013
36.795
+2.185
6.31%
Ranking of countries by current statistics by years