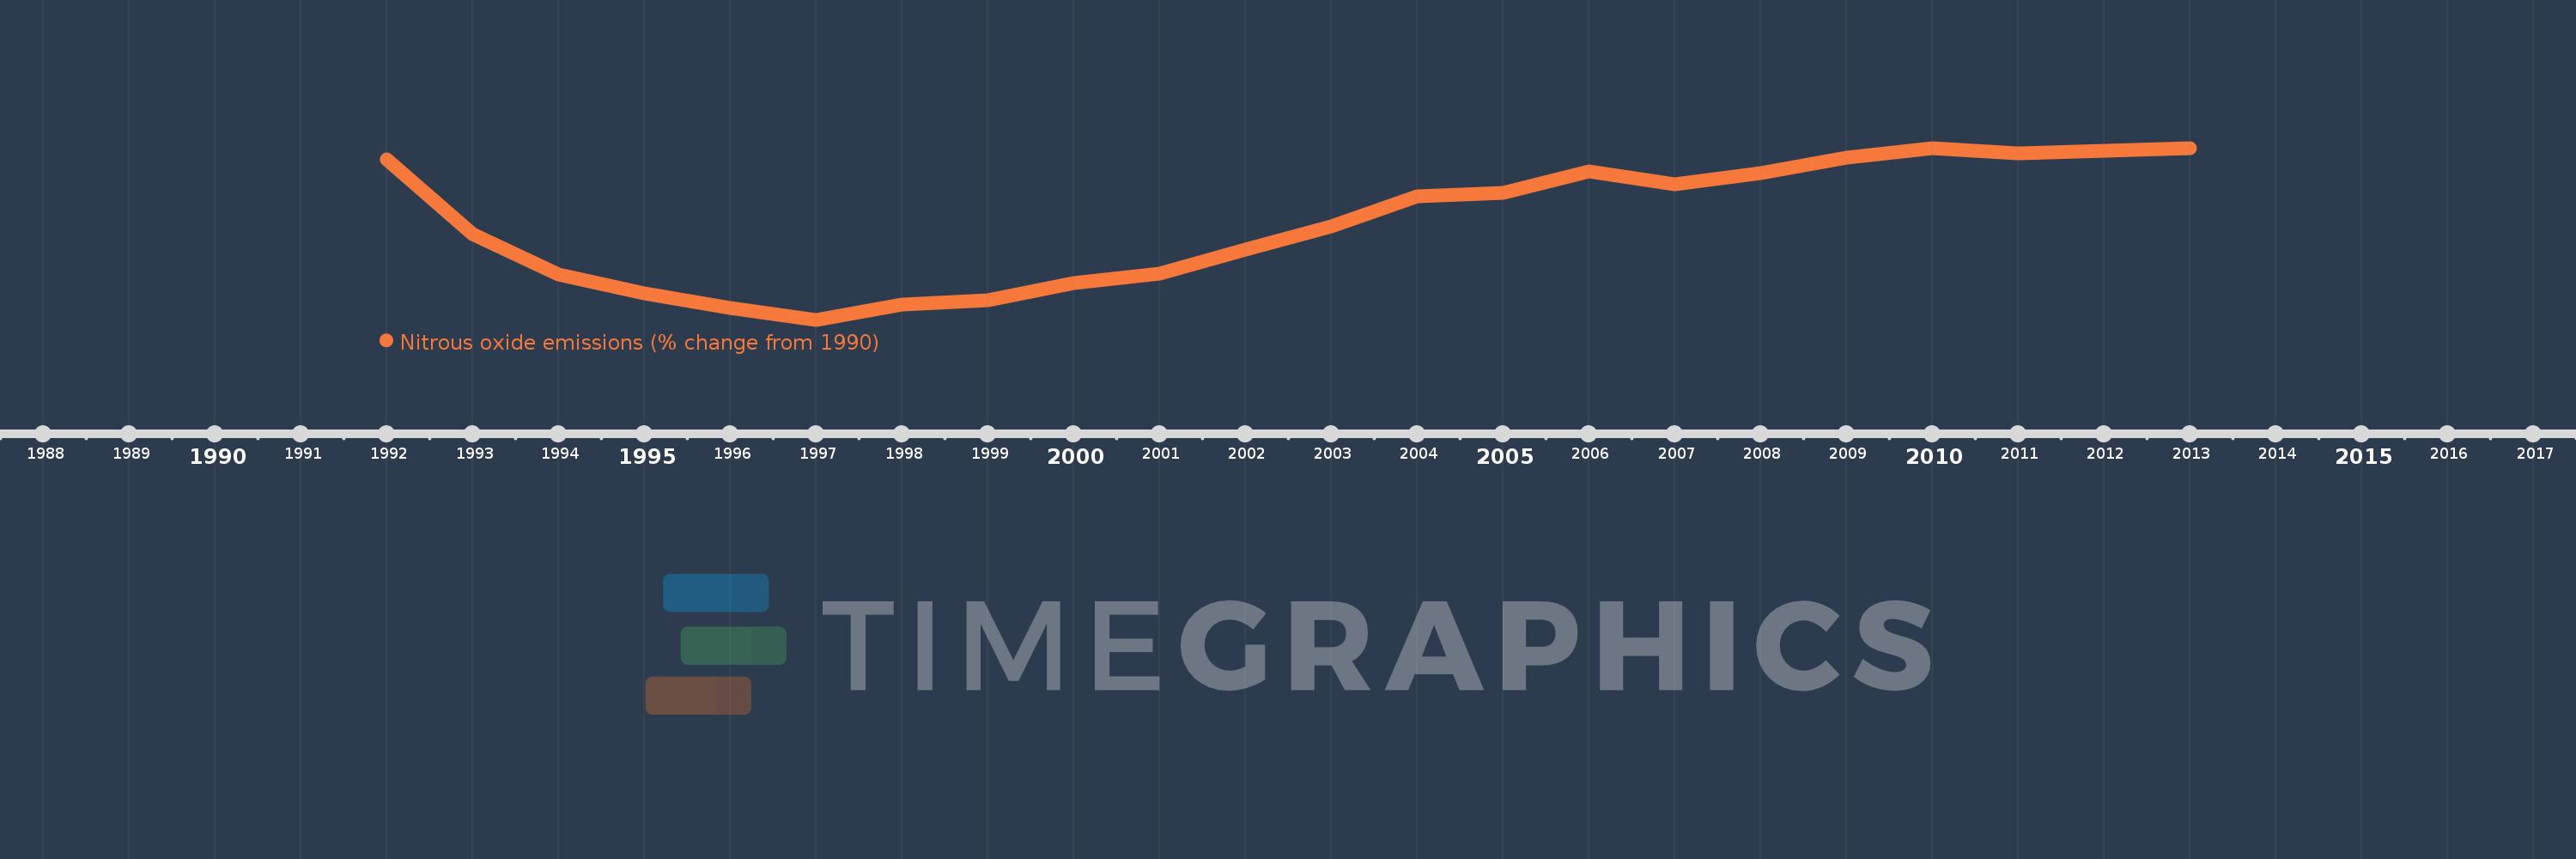
This timeline shows a graph from 1992 to 2013 of Azerbaijan. No data until 1991. Number of actual observations by date: 22.
Source name:
World Development Indicators
Source organization:
World Bank staff estimates from original source: European Commission, Joint Research Centre (JRC)/Netherlands Environmental Assessment Agency (PBL). Emission Database for Global Atmospheric Research (EDGAR): http://edgar.jrc.ec.europa.eu/.
Categories, topics:
Climate Change, Environment
Last updated:
apr 23, 2017
Indicators value changes by year
Meaning:
-14.071
Minimum:
-32.7
jan 1, 1997
Maximum:
0.315
jan 1, 2010
At the date of observation
Value
Absolute change
Change from the previous value
jan 1, 1992
-1.934
-1.934
0.0%
jan 1, 1993
-16.239
-14.304
739.46%
jan 1, 1994
-23.97
-7.731
47.61%
jan 1, 1995
-27.594
-3.624
15.12%
jan 1, 1996
-30.433
-2.839
10.29%
jan 1, 1997
-32.7
-2.267
7.45%
jan 1, 1998
-29.725
+2.975
-9.1%
jan 1, 1999
-28.974
+0.751
-2.53%
jan 1, 2000
-25.598
+3.376
-11.65%
jan 1, 2001
-23.854
+1.744
-6.81%
jan 1, 2002
-19.204
+4.65
-19.49%
jan 1, 2003
-14.71
+4.494
-23.4%
jan 1, 2004
-9.057
+5.653
-38.43%
jan 1, 2005
-8.285
+0.772
-8.52%
jan 1, 2006
-4.145
+4.14
-49.97%
jan 1, 2007
-6.663
-2.519
60.77%
jan 1, 2008
-4.462
+2.202
-33.04%
jan 1, 2009
-1.615
+2.847
-63.8%
jan 1, 2010
0.315
+1.93
-119.49%
jan 1, 2011
-0.721
-1.036
-329.1%
jan 1, 2012
-0.234
+0.487
-67.56%
jan 1, 2013
0.253
+0.487
-208.26%
Ranking of countries by current statistics by years