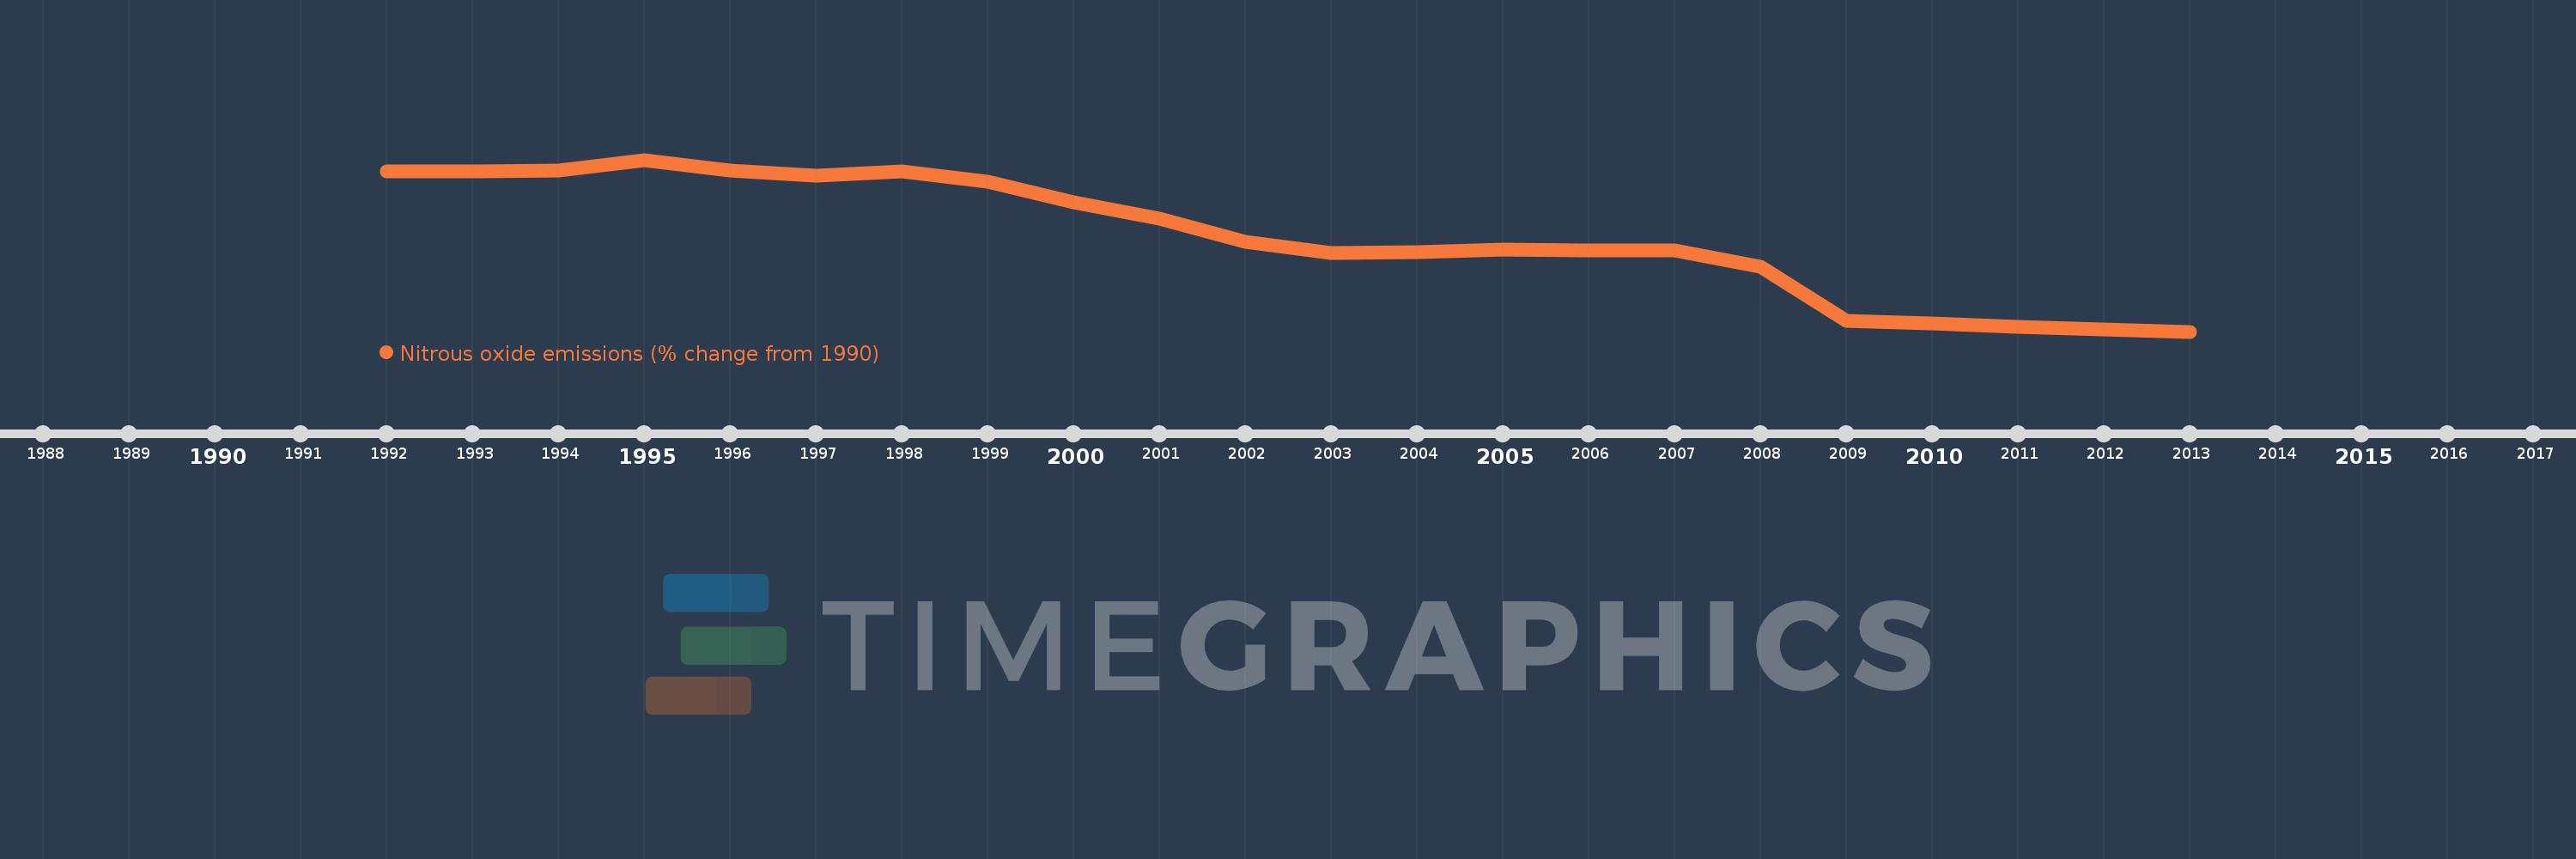
This timeline shows a graph from 1992 to 2013 of Netherlands. No data until 1991. Number of actual observations by date: 22.
Source name:
World Development Indicators
Source organization:
World Bank staff estimates from original source: European Commission, Joint Research Centre (JRC)/Netherlands Environmental Assessment Agency (PBL). Emission Database for Global Atmospheric Research (EDGAR): http://edgar.jrc.ec.europa.eu/.
Categories, topics:
Climate Change, Environment
Last updated:
apr 23, 2017
Indicators value changes by year
Meaning:
-20.672
Minimum:
-50.248
jan 1, 2013
Maximum:
2.803
jan 1, 1995
At the date of observation
Value
Absolute change
Change from the previous value
jan 1, 1992
-0.651
-0.651
0.0%
jan 1, 1993
-0.798
-0.147
22.51%
jan 1, 1994
-0.541
+0.256
-32.15%
jan 1, 1995
2.803
+3.344
-617.82%
jan 1, 1996
-0.496
-3.299
-117.71%
jan 1, 1997
-1.992
-1.495
301.29%
jan 1, 1998
-0.757
+1.234
-61.97%
jan 1, 1999
-3.836
-3.079
406.43%
jan 1, 2000
-10.254
-6.418
167.3%
jan 1, 2001
-15.316
-5.061
49.36%
jan 1, 2002
-22.595
-7.28
47.53%
jan 1, 2003
-26.101
-3.505
15.51%
jan 1, 2004
-25.816
+0.285
-1.09%
jan 1, 2005
-25.032
+0.784
-3.04%
jan 1, 2006
-25.206
-0.174
0.7%
jan 1, 2007
-25.216
-0.01
0.04%
jan 1, 2008
-30.092
-4.876
19.34%
jan 1, 2009
-46.813
-16.721
55.56%
jan 1, 2010
-47.674
-0.862
1.84%
jan 1, 2011
-48.684
-1.01
2.12%
jan 1, 2012
-49.466
-0.782
1.61%
jan 1, 2013
-50.248
-0.782
1.58%
Ranking of countries by current statistics by years