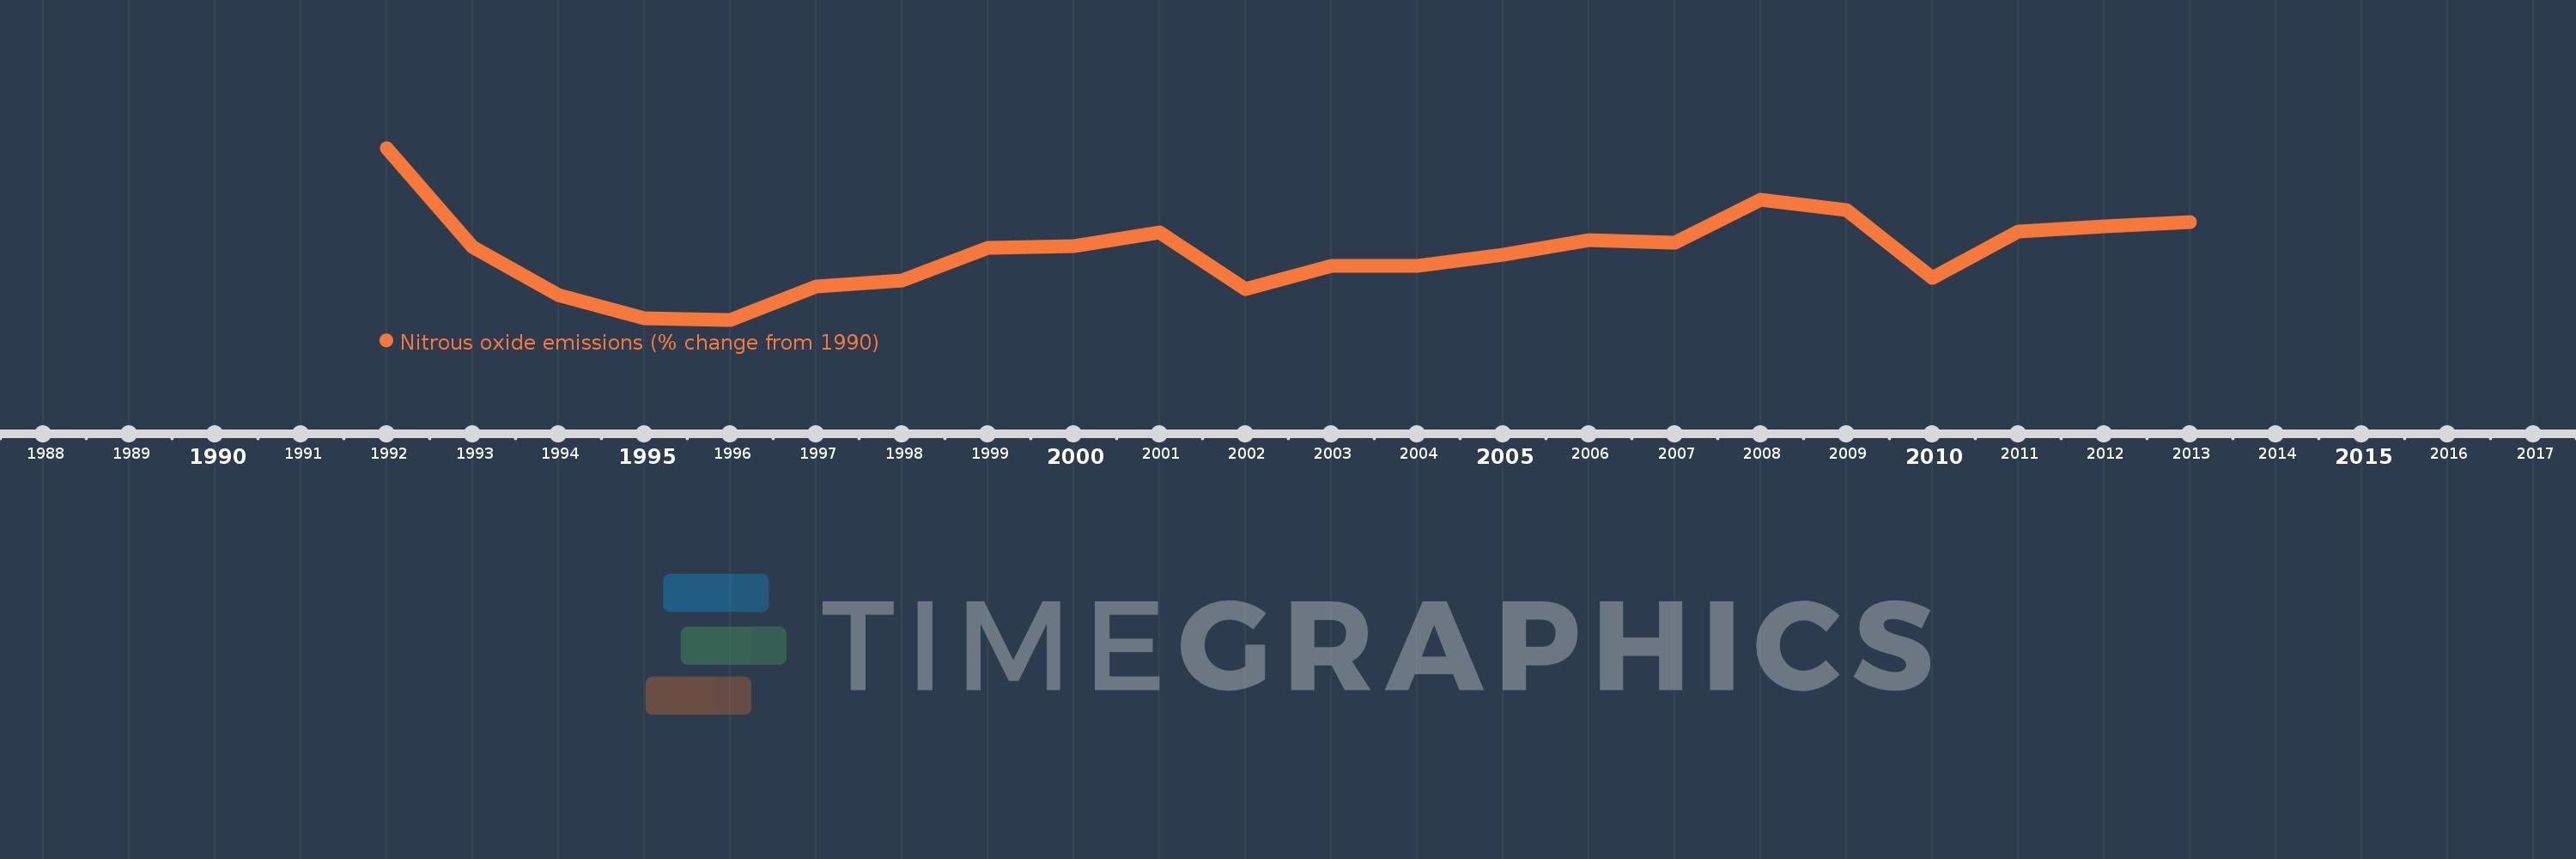
This timeline shows a graph from 1992 to 2013 of Lithuania. No data until 1991. Number of actual observations by date: 22.
Source name:
World Development Indicators
Source organization:
World Bank staff estimates from original source: European Commission, Joint Research Centre (JRC)/Netherlands Environmental Assessment Agency (PBL). Emission Database for Global Atmospheric Research (EDGAR): http://edgar.jrc.ec.europa.eu/.
Categories, topics:
Climate Change, Environment
Last updated:
apr 23, 2017
Indicators value changes by year
Meaning:
-26.19
Minimum:
-44.693
jan 1, 1996
Maximum:
2.388
jan 1, 1992
At the date of observation
Value
Absolute change
Change from the previous value
jan 1, 1992
2.388
+2.388
0.0%
jan 1, 1993
-24.76
-27.148
-1.14K%
jan 1, 1994
-38.049
-13.289
53.67%
jan 1, 1995
-44.294
-6.245
16.41%
jan 1, 1996
-44.693
-0.399
0.9%
jan 1, 1997
-35.58
+9.113
-20.39%
jan 1, 1998
-33.85
+1.73
-4.86%
jan 1, 1999
-25.014
+8.836
-26.1%
jan 1, 2000
-24.626
+0.388
-1.55%
jan 1, 2001
-20.828
+3.798
-15.42%
jan 1, 2002
-36.332
-15.504
74.44%
jan 1, 2003
-29.886
+6.446
-17.74%
jan 1, 2004
-29.975
-0.089
0.3%
jan 1, 2005
-26.828
+3.147
-10.5%
jan 1, 2006
-22.939
+3.889
-14.49%
jan 1, 2007
-23.632
-0.693
3.02%
jan 1, 2008
-11.84
+11.792
-49.9%
jan 1, 2009
-14.636
-2.796
23.62%
jan 1, 2010
-33.219
-18.583
126.97%
jan 1, 2011
-20.418
+12.801
-38.53%
jan 1, 2012
-19.194
+1.224
-6.0%
jan 1, 2013
-17.97
+1.224
-6.38%
Ranking of countries by current statistics by years