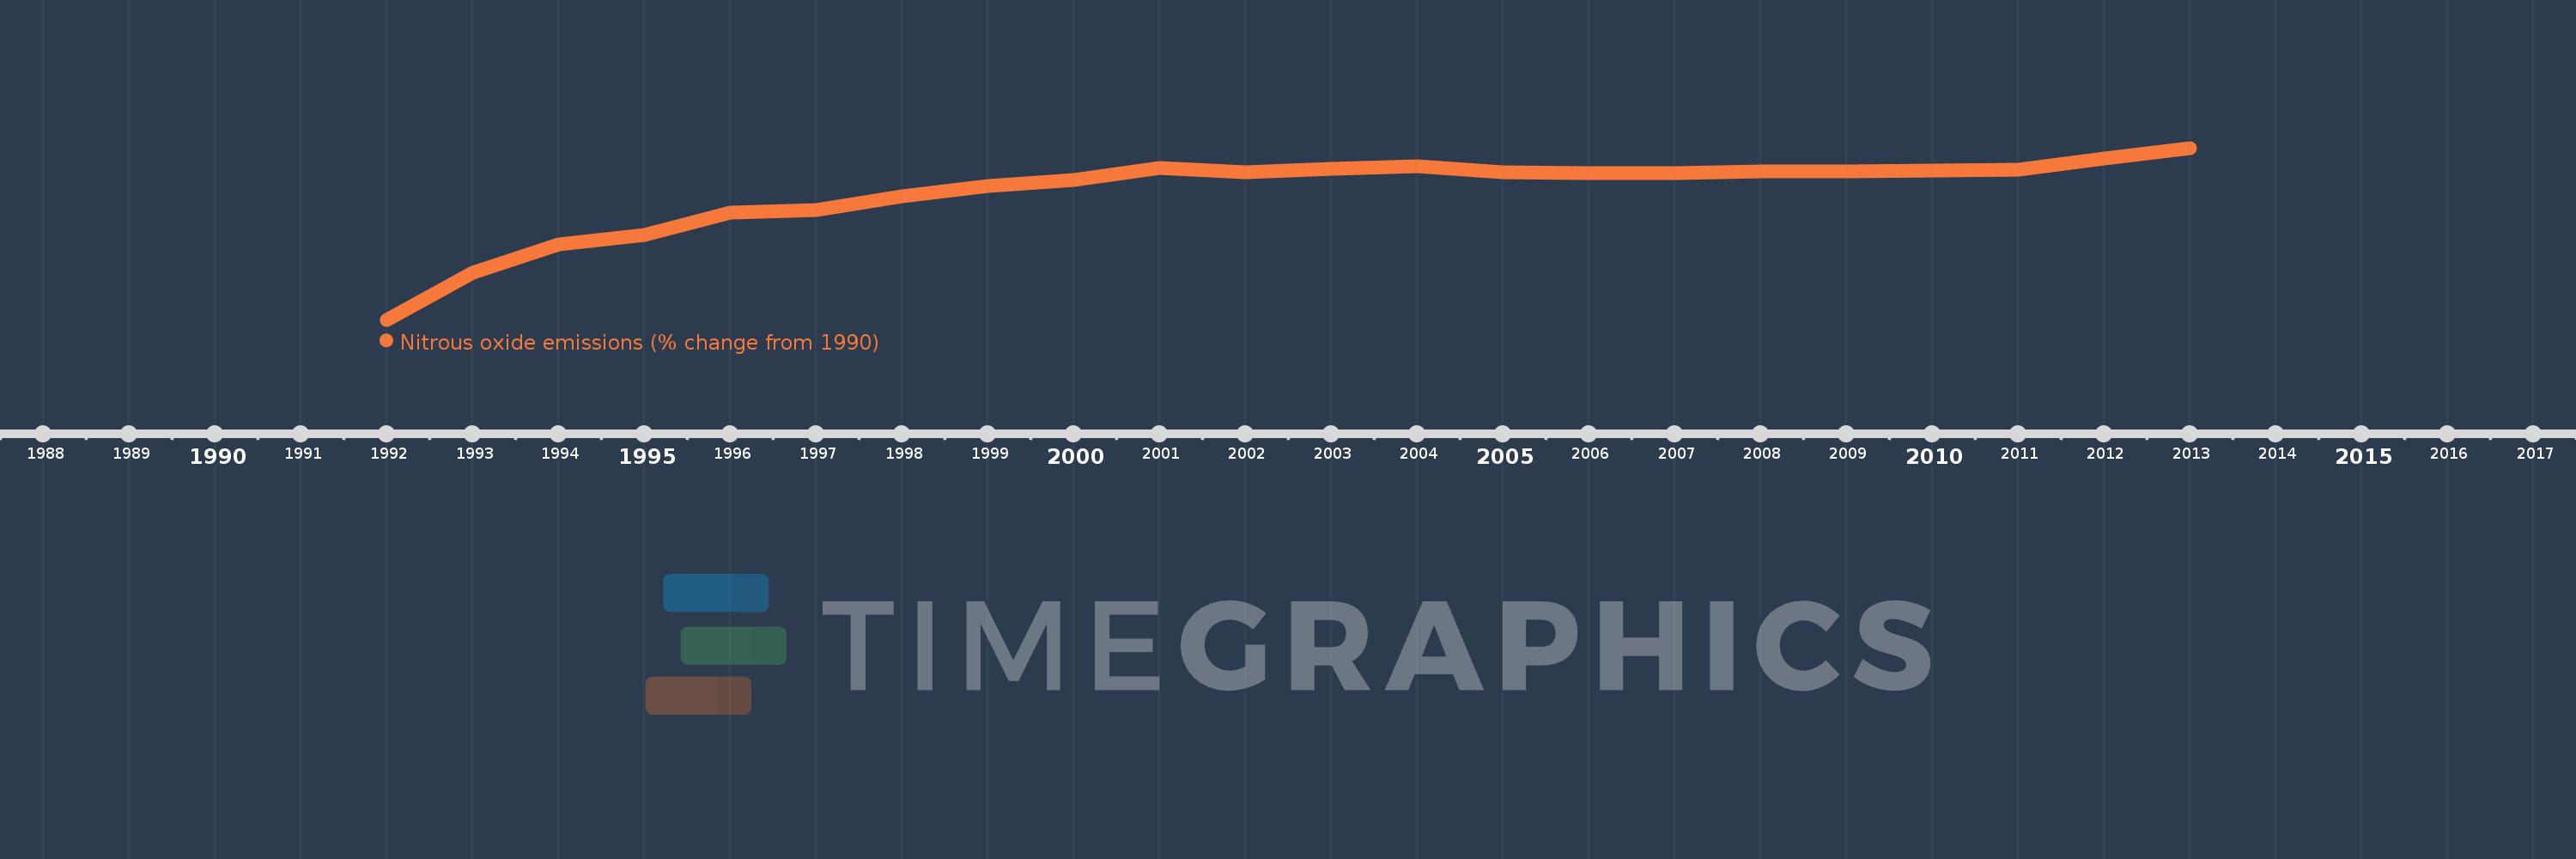
This timeline shows a graph from 1992 to 2013 of Nauru. No data until 1991. Number of actual observations by date: 22.
Source name:
World Development Indicators
Source organization:
World Bank staff estimates from original source: European Commission, Joint Research Centre (JRC)/Netherlands Environmental Assessment Agency (PBL). Emission Database for Global Atmospheric Research (EDGAR): http://edgar.jrc.ec.europa.eu/.
Categories, topics:
Climate Change, Environment
Last updated:
apr 23, 2017
Indicators value changes by year
Meaning:
18.101
Minimum:
3.878
jan 1, 1992
Maximum:
23.109
jan 1, 2013
At the date of observation
Value
Absolute change
Change from the previous value
jan 1, 1992
3.878
+3.878
0.0%
jan 1, 1993
9.091
+5.213
134.41%
jan 1, 1994
12.264
+3.173
34.9%
jan 1, 1995
13.366
+1.102
8.99%
jan 1, 1996
15.85
+2.484
18.59%
jan 1, 1997
16.203
+0.353
2.23%
jan 1, 1998
17.726
+1.523
9.4%
jan 1, 1999
18.844
+1.118
6.31%
jan 1, 2000
19.535
+0.69
3.66%
jan 1, 2001
20.861
+1.326
6.79%
jan 1, 2002
20.403
-0.458
-2.19%
jan 1, 2003
20.78
+0.377
1.85%
jan 1, 2004
21.097
+0.317
1.53%
jan 1, 2005
20.406
-0.691
-3.27%
jan 1, 2006
20.278
-0.128
-0.63%
jan 1, 2007
20.333
+0.055
0.27%
jan 1, 2008
20.451
+0.118
0.58%
jan 1, 2009
20.528
+0.076
0.37%
jan 1, 2010
20.611
+0.084
0.41%
jan 1, 2011
20.695
+0.084
0.41%
jan 1, 2012
21.902
+1.207
5.83%
jan 1, 2013
23.109
+1.207
5.51%
Ranking of countries by current statistics by years