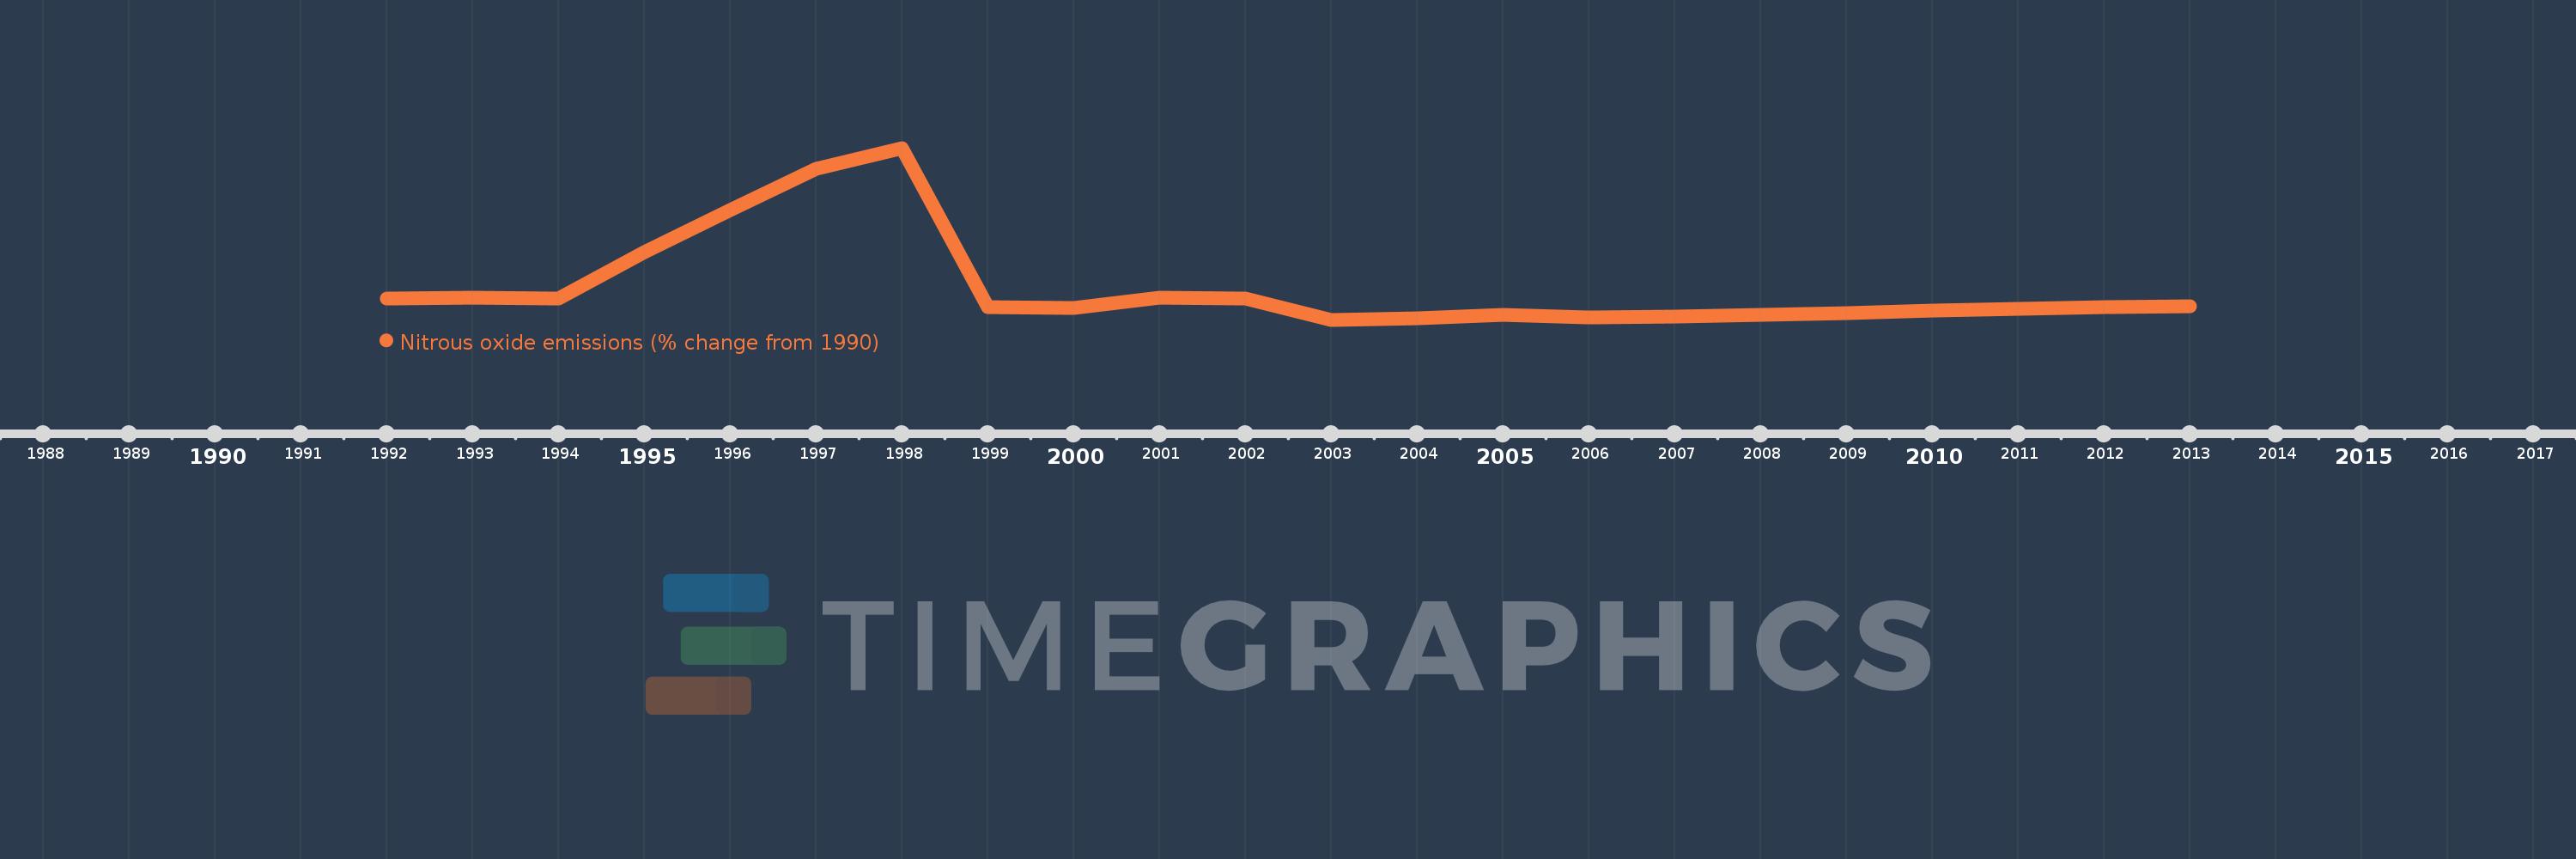
This timeline shows a graph from 1992 to 2013 of St. Lucia. No data until 1991. Number of actual observations by date: 22.
Source name:
World Development Indicators
Source organization:
World Bank staff estimates from original source: European Commission, Joint Research Centre (JRC)/Netherlands Environmental Assessment Agency (PBL). Emission Database for Global Atmospheric Research (EDGAR): http://edgar.jrc.ec.europa.eu/.
Categories, topics:
Climate Change, Environment
Last updated:
apr 23, 2017
Indicators value changes by year
Meaning:
31.64
Minimum:
0.171
jan 1, 2003
Maximum:
169.943
jan 1, 1998
At the date of observation
Value
Absolute change
Change from the previous value
jan 1, 1992
20.968
+20.968
0.0%
jan 1, 1993
21.985
+1.017
4.85%
jan 1, 1994
21.223
-0.762
-3.47%
jan 1, 1995
66.927
+45.703
215.34%
jan 1, 1996
108.433
+41.506
62.02%
jan 1, 1997
149.068
+40.635
37.47%
jan 1, 1998
169.943
+20.875
14.0%
jan 1, 1999
12.664
-157.279
-92.55%
jan 1, 2000
12.057
-0.607
-4.79%
jan 1, 2001
21.637
+9.58
79.46%
jan 1, 2002
21.003
-0.634
-2.93%
jan 1, 2003
0.171
-20.832
-99.19%
jan 1, 2004
1.609
+1.438
841.39%
jan 1, 2005
4.745
+3.136
194.85%
jan 1, 2006
2.357
-2.388
-50.32%
jan 1, 2007
3.722
+1.365
57.9%
jan 1, 2008
5.043
+1.321
35.5%
jan 1, 2009
6.54
+1.497
29.68%
jan 1, 2010
8.841
+2.301
35.18%
jan 1, 2011
11.27
+2.429
27.48%
jan 1, 2012
12.382
+1.113
9.87%
jan 1, 2013
13.495
+1.113
8.99%
Ranking of countries by current statistics by years