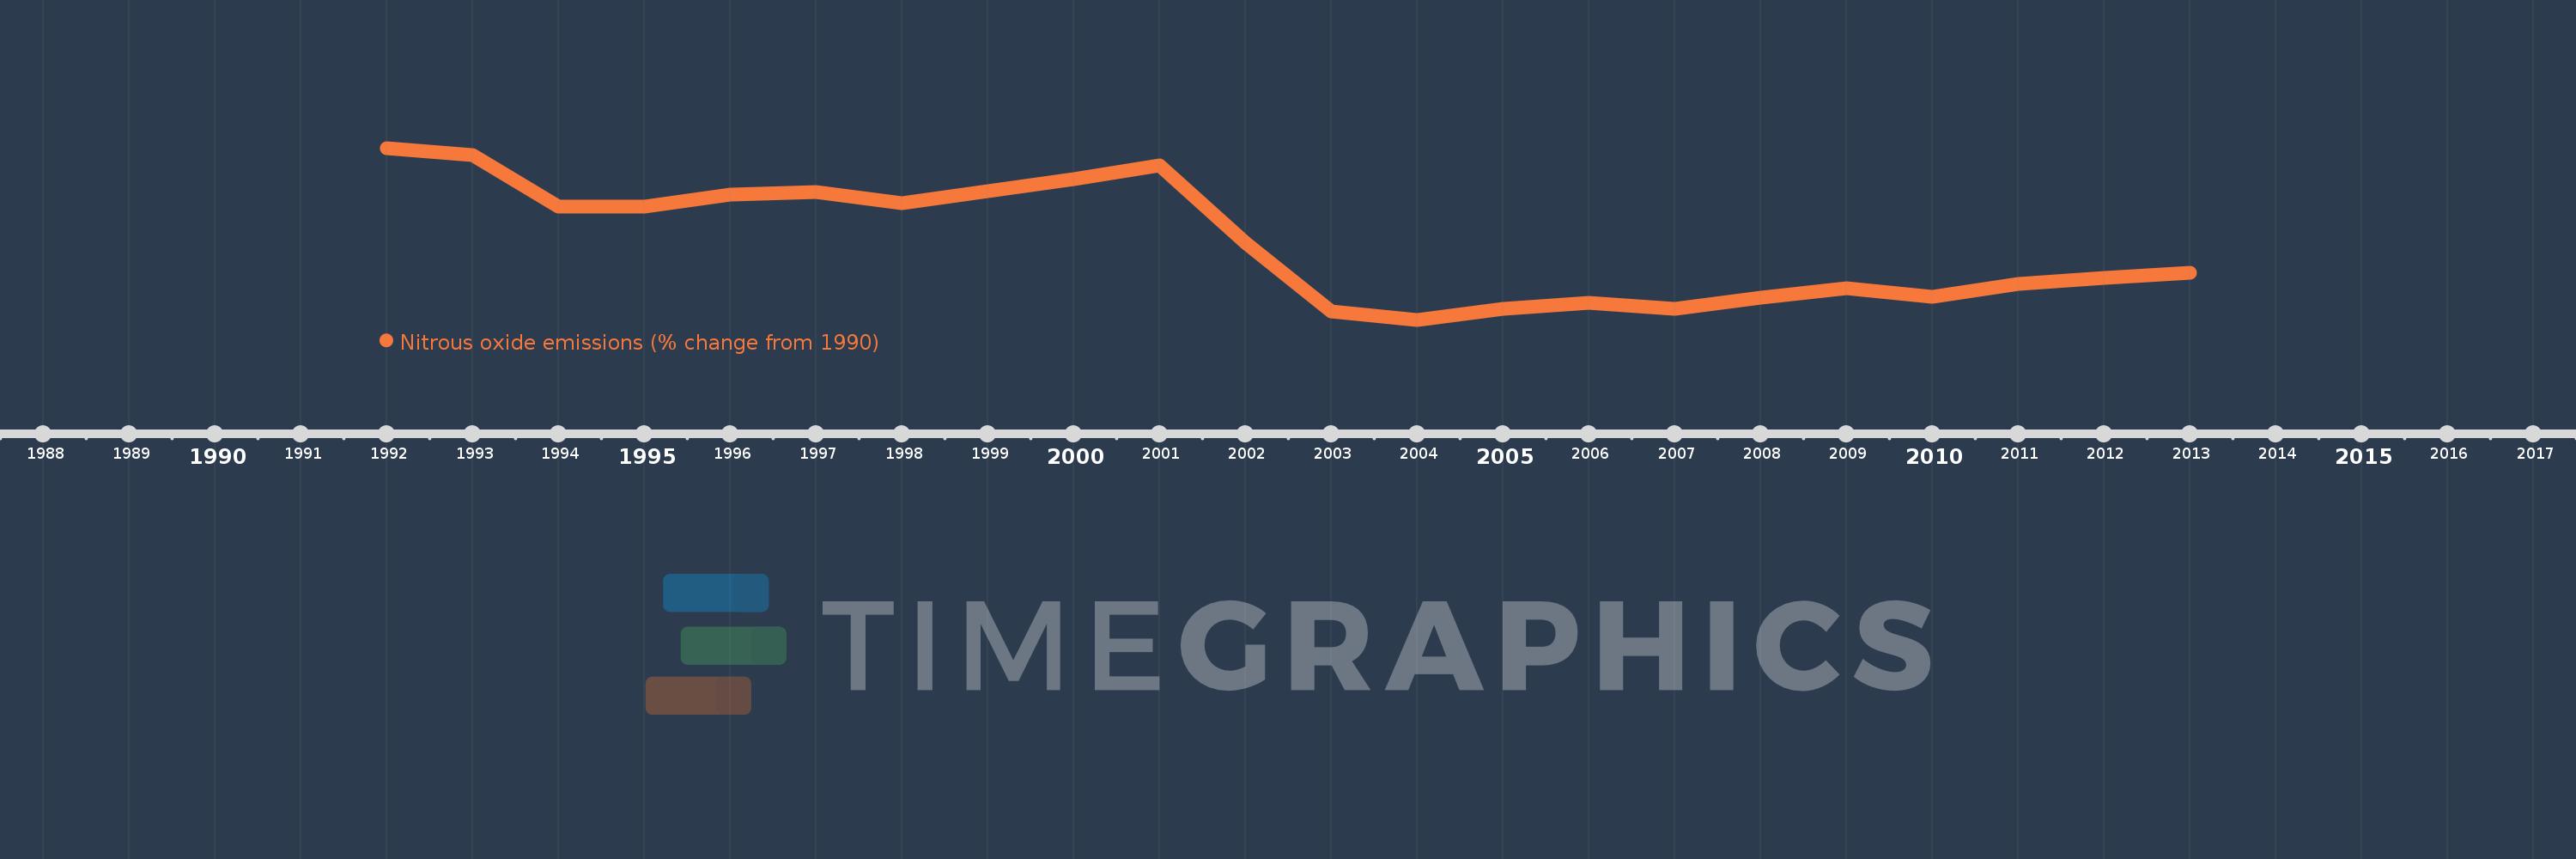
This timeline shows a graph from 1992 to 2013 of Barbados. No data until 1991. Number of actual observations by date: 22.
Source name:
World Development Indicators
Source organization:
World Bank staff estimates from original source: European Commission, Joint Research Centre (JRC)/Netherlands Environmental Assessment Agency (PBL). Emission Database for Global Atmospheric Research (EDGAR): http://edgar.jrc.ec.europa.eu/.
Categories, topics:
Climate Change, Environment
Last updated:
apr 23, 2017
Indicators value changes by year
Meaning:
-11.941
Minimum:
-22.886
jan 1, 2004
Maximum:
1.723
jan 1, 1992
At the date of observation
Value
Absolute change
Change from the previous value
jan 1, 1992
1.723
+1.723
0.0%
jan 1, 1993
0.692
-1.031
-59.85%
jan 1, 1994
-6.707
-7.399
-1.07K%
jan 1, 1995
-6.653
+0.054
-0.8%
jan 1, 1996
-4.972
+1.681
-25.27%
jan 1, 1997
-4.605
+0.367
-7.39%
jan 1, 1998
-6.247
-1.642
35.67%
jan 1, 1999
-4.491
+1.756
-28.11%
jan 1, 2000
-2.743
+1.748
-38.92%
jan 1, 2001
-0.732
+2.011
-73.32%
jan 1, 2002
-11.824
-11.092
1.52K%
jan 1, 2003
-21.722
-9.898
83.71%
jan 1, 2004
-22.886
-1.163
5.36%
jan 1, 2005
-21.318
+1.568
-6.85%
jan 1, 2006
-20.436
+0.882
-4.14%
jan 1, 2007
-21.28
-0.845
4.13%
jan 1, 2008
-19.718
+1.562
-7.34%
jan 1, 2009
-18.406
+1.312
-6.65%
jan 1, 2010
-19.587
-1.181
6.41%
jan 1, 2011
-17.756
+1.831
-9.35%
jan 1, 2012
-16.933
+0.822
-4.63%
jan 1, 2013
-16.111
+0.822
-4.86%
Ranking of countries by current statistics by years