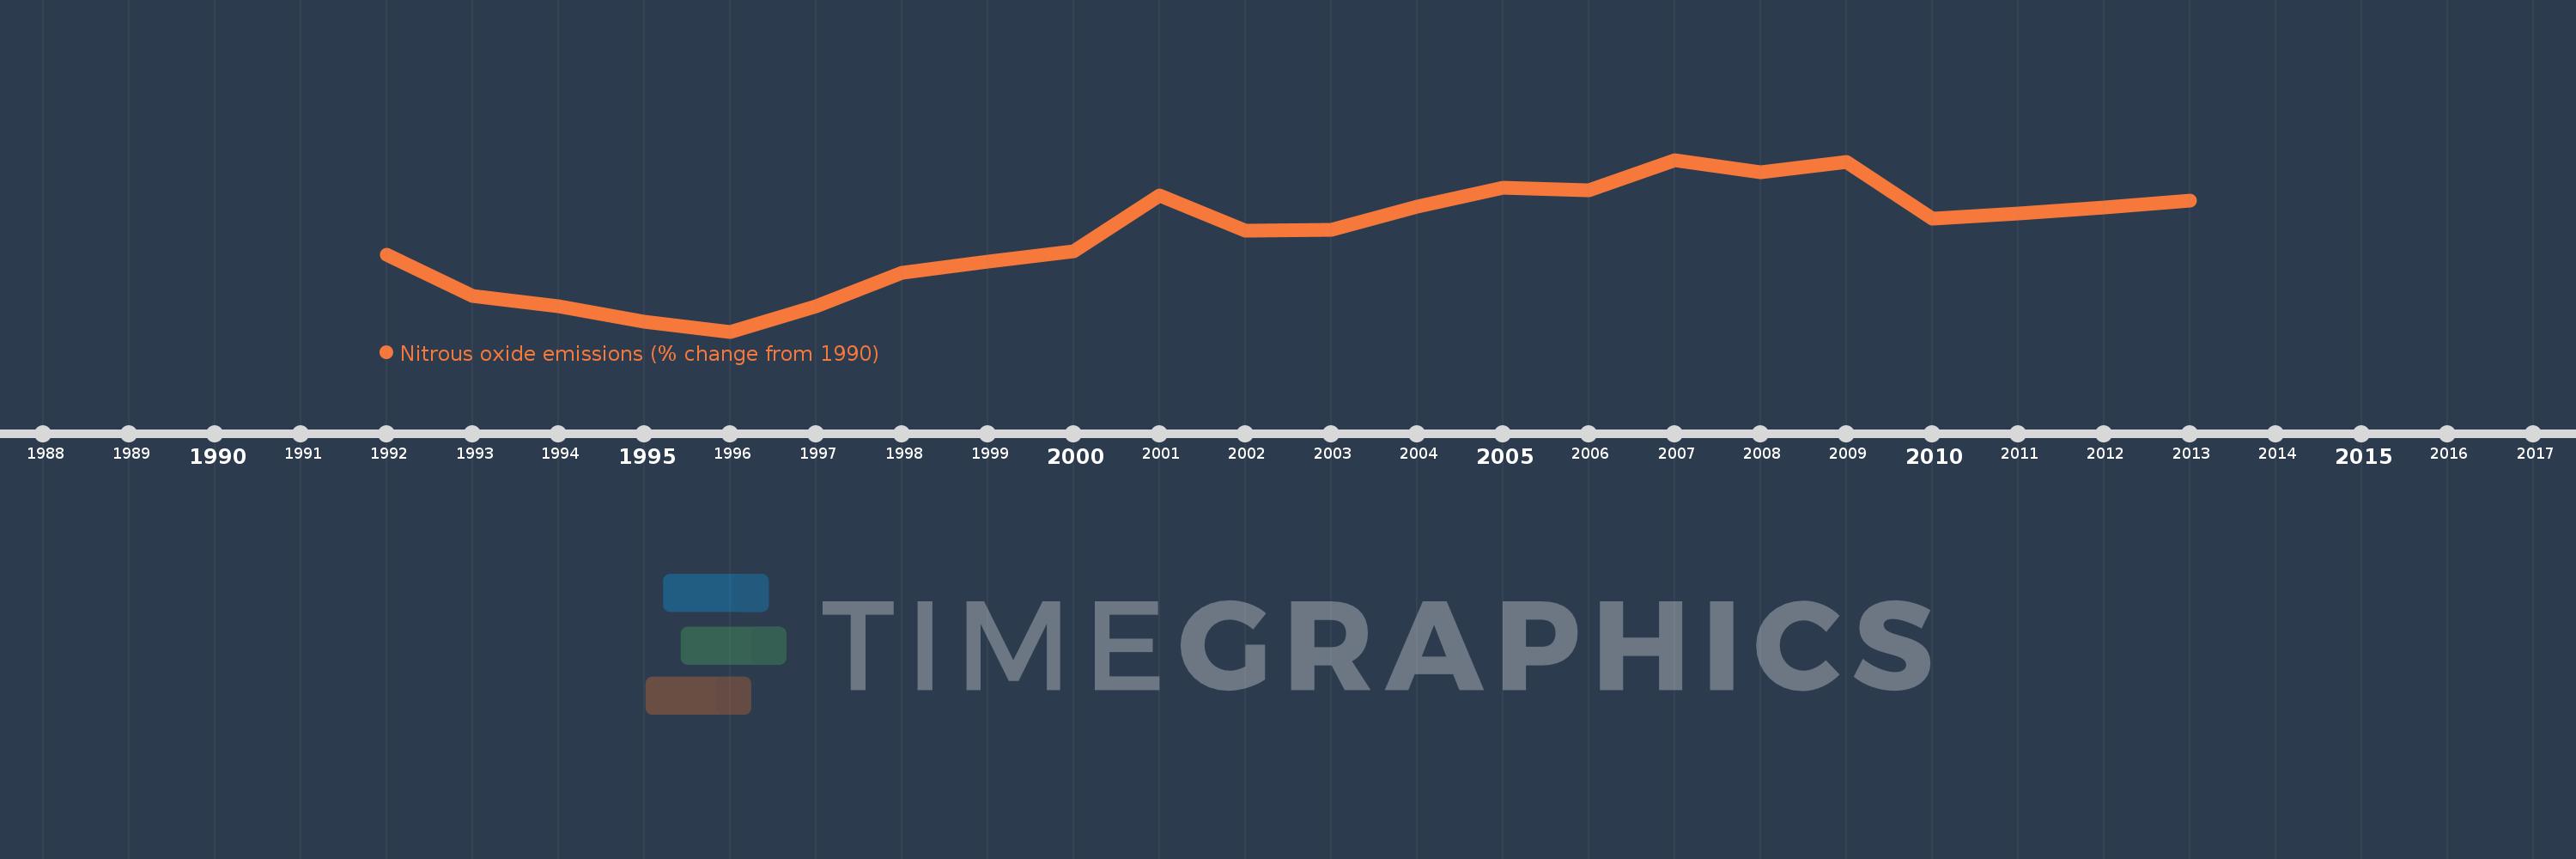
This timeline shows a graph from 1992 to 2013 of Morocco. No data until 1991. Number of actual observations by date: 22.
Source name:
World Development Indicators
Source organization:
World Bank staff estimates from original source: European Commission, Joint Research Centre (JRC)/Netherlands Environmental Assessment Agency (PBL). Emission Database for Global Atmospheric Research (EDGAR): http://edgar.jrc.ec.europa.eu/.
Categories, topics:
Climate Change, Environment
Last updated:
apr 23, 2017
Indicators value changes by year
Meaning:
-0.358
Minimum:
-16.412
jan 1, 1996
Maximum:
12.248
jan 1, 2007
At the date of observation
Value
Absolute change
Change from the previous value
jan 1, 1992
-3.566
-3.566
0.0%
jan 1, 1993
-10.489
-6.923
194.13%
jan 1, 1994
-12.214
-1.726
16.45%
jan 1, 1995
-14.827
-2.613
21.39%
jan 1, 1996
-16.412
-1.585
10.69%
jan 1, 1997
-12.233
+4.178
-25.46%
jan 1, 1998
-6.56
+5.673
-46.37%
jan 1, 1999
-4.767
+1.794
-27.34%
jan 1, 2000
-3.0
+1.766
-37.06%
jan 1, 2001
6.364
+9.364
-312.11%
jan 1, 2002
0.38
-5.984
-94.03%
jan 1, 2003
0.531
+0.151
39.77%
jan 1, 2004
4.47
+3.939
741.35%
jan 1, 2005
7.521
+3.05
68.24%
jan 1, 2006
7.139
-0.382
-5.08%
jan 1, 2007
12.248
+5.109
71.58%
jan 1, 2008
10.177
-2.071
-16.91%
jan 1, 2009
11.889
+1.712
16.82%
jan 1, 2010
2.418
-9.471
-79.66%
jan 1, 2011
3.322
+0.904
37.38%
jan 1, 2012
4.355
+1.033
31.1%
jan 1, 2013
5.388
+1.033
23.72%
Ranking of countries by current statistics by years