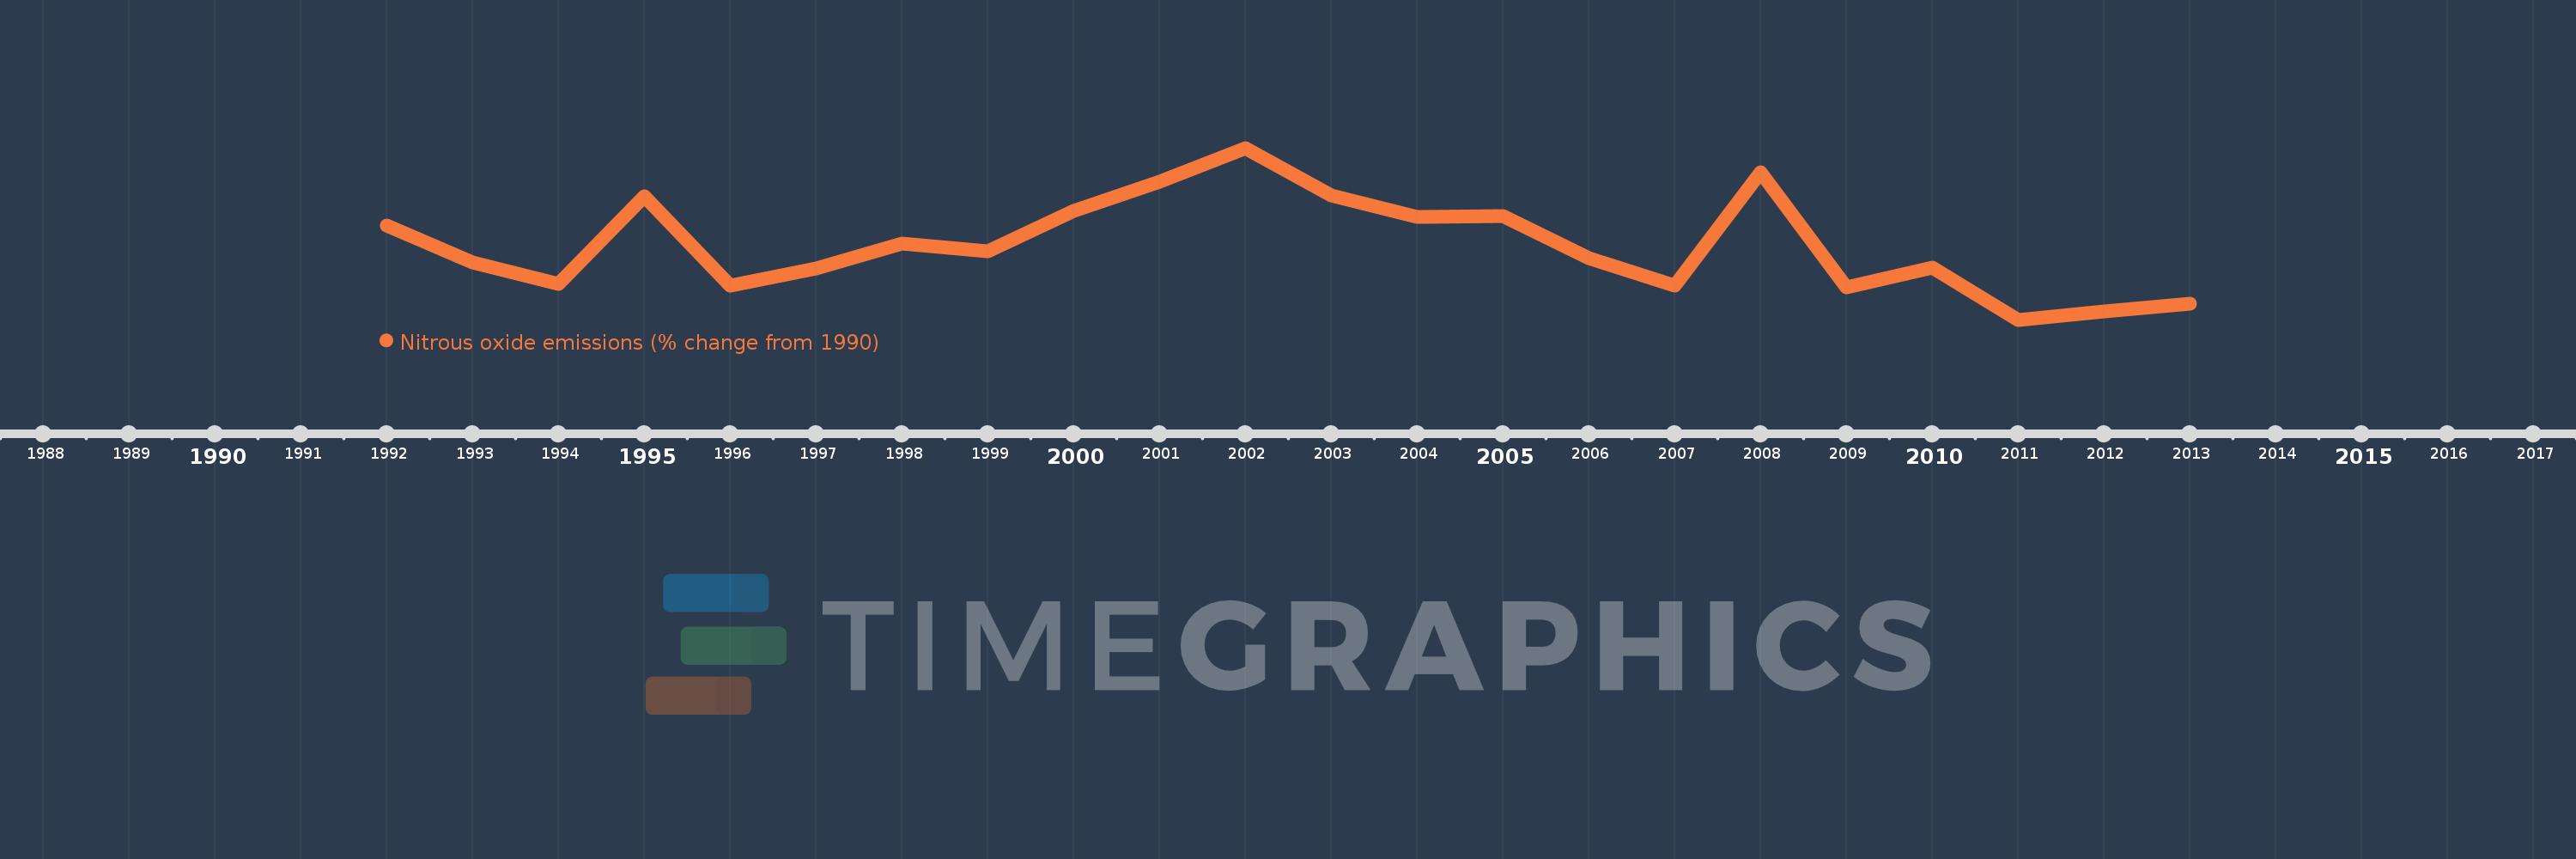
This timeline shows a graph from 1992 to 2013 of Australia. No data until 1991. Number of actual observations by date: 22.
Source name:
World Development Indicators
Source organization:
World Bank staff estimates from original source: European Commission, Joint Research Centre (JRC)/Netherlands Environmental Assessment Agency (PBL). Emission Database for Global Atmospheric Research (EDGAR): http://edgar.jrc.ec.europa.eu/.
Categories, topics:
Climate Change, Environment
Last updated:
apr 23, 2017
Indicators value changes by year
Meaning:
2.598
Minimum:
-18.176
jan 1, 2011
Maximum:
29.597
jan 1, 2002
At the date of observation
Value
Absolute change
Change from the previous value
jan 1, 1992
7.953
+7.953
0.0%
jan 1, 1993
-2.327
-10.281
-129.26%
jan 1, 1994
-8.222
-5.895
253.26%
jan 1, 1995
16.08
+24.302
-295.57%
jan 1, 1996
-8.598
-24.677
-153.47%
jan 1, 1997
-3.846
+4.752
-55.27%
jan 1, 1998
2.993
+6.839
-177.84%
jan 1, 1999
0.949
-2.044
-68.29%
jan 1, 2000
12.182
+11.233
1.18K%
jan 1, 2001
20.174
+7.991
65.6%
jan 1, 2002
29.597
+9.423
46.71%
jan 1, 2003
16.394
-13.203
-44.61%
jan 1, 2004
10.516
-5.877
-35.85%
jan 1, 2005
10.693
+0.177
1.68%
jan 1, 2006
-0.971
-11.664
-109.08%
jan 1, 2007
-8.76
-7.789
802.59%
jan 1, 2008
22.917
+31.677
-361.62%
jan 1, 2009
-9.101
-32.019
-139.71%
jan 1, 2010
-3.593
+5.508
-60.52%
jan 1, 2011
-18.176
-14.583
405.84%
jan 1, 2012
-15.962
+2.215
-12.18%
jan 1, 2013
-13.747
+2.215
-13.87%
Ranking of countries by current statistics by years