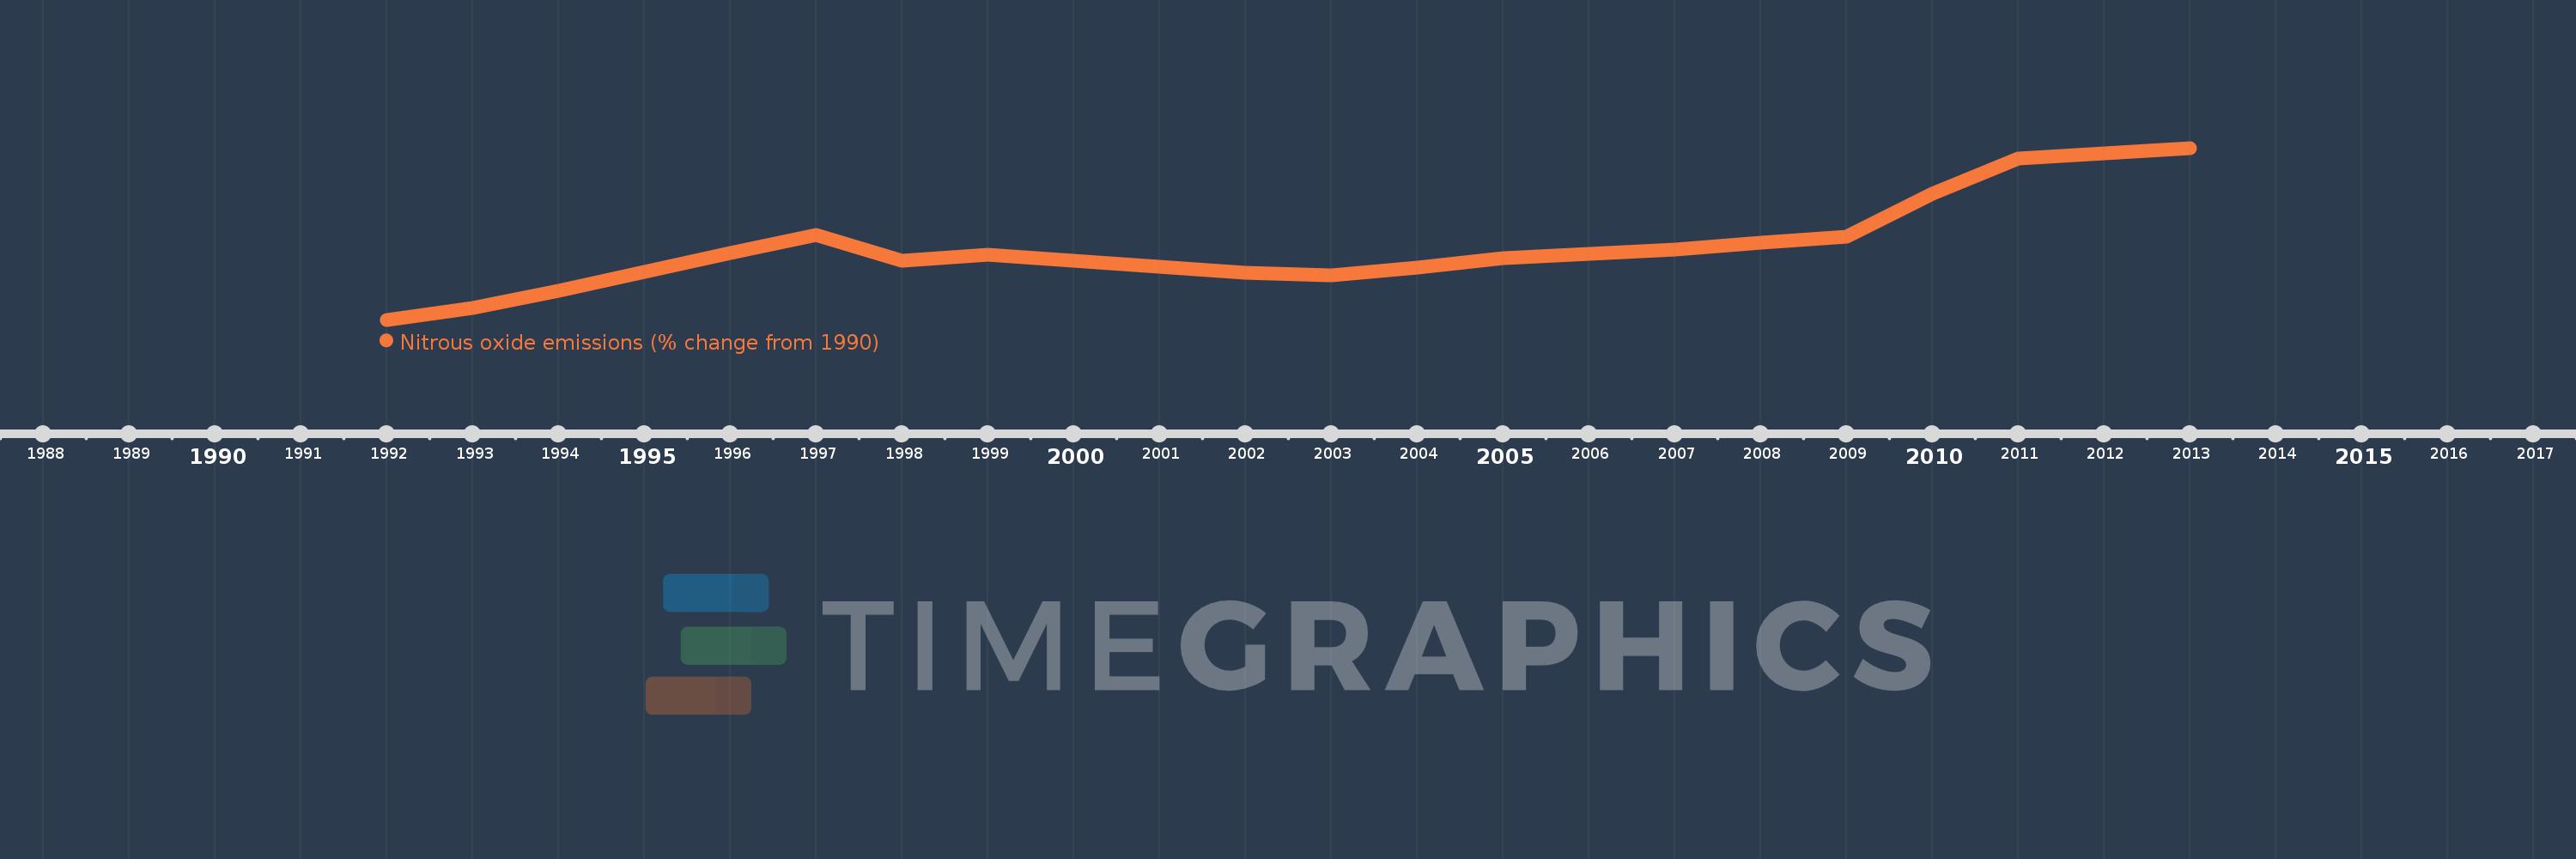
This timeline shows a graph from 1992 to 2013 of Bangladesh. No data until 1991. Number of actual observations by date: 22.
Source name:
World Development Indicators
Source organization:
World Bank staff estimates from original source: European Commission, Joint Research Centre (JRC)/Netherlands Environmental Assessment Agency (PBL). Emission Database for Global Atmospheric Research (EDGAR): http://edgar.jrc.ec.europa.eu/.
Categories, topics:
Climate Change, Environment
Last updated:
apr 23, 2017
Indicators value changes by year
Meaning:
34.385
Minimum:
12.075
jan 1, 1992
Maximum:
64.694
jan 1, 2013
At the date of observation
Value
Absolute change
Change from the previous value
jan 1, 1992
12.075
+12.075
0.0%
jan 1, 1993
15.73
+3.655
30.27%
jan 1, 1994
20.948
+5.218
33.17%
jan 1, 1995
26.83
+5.882
28.08%
jan 1, 1996
32.441
+5.61
20.91%
jan 1, 1997
38.069
+5.628
17.35%
jan 1, 1998
30.091
-7.978
-20.96%
jan 1, 1999
31.973
+1.882
6.25%
jan 1, 2000
30.112
-1.861
-5.82%
jan 1, 2001
28.199
-1.913
-6.35%
jan 1, 2002
26.371
-1.828
-6.48%
jan 1, 2003
25.765
-0.606
-2.3%
jan 1, 2004
27.969
+2.204
8.55%
jan 1, 2005
30.816
+2.846
10.18%
jan 1, 2006
32.315
+1.5
4.87%
jan 1, 2007
33.515
+1.2
3.71%
jan 1, 2008
35.643
+2.128
6.35%
jan 1, 2009
37.634
+1.991
5.59%
jan 1, 2010
50.741
+13.106
34.83%
jan 1, 2011
61.465
+10.724
21.14%
jan 1, 2012
63.08
+1.615
2.63%
jan 1, 2013
64.694
+1.615
2.56%
Ranking of countries by current statistics by years