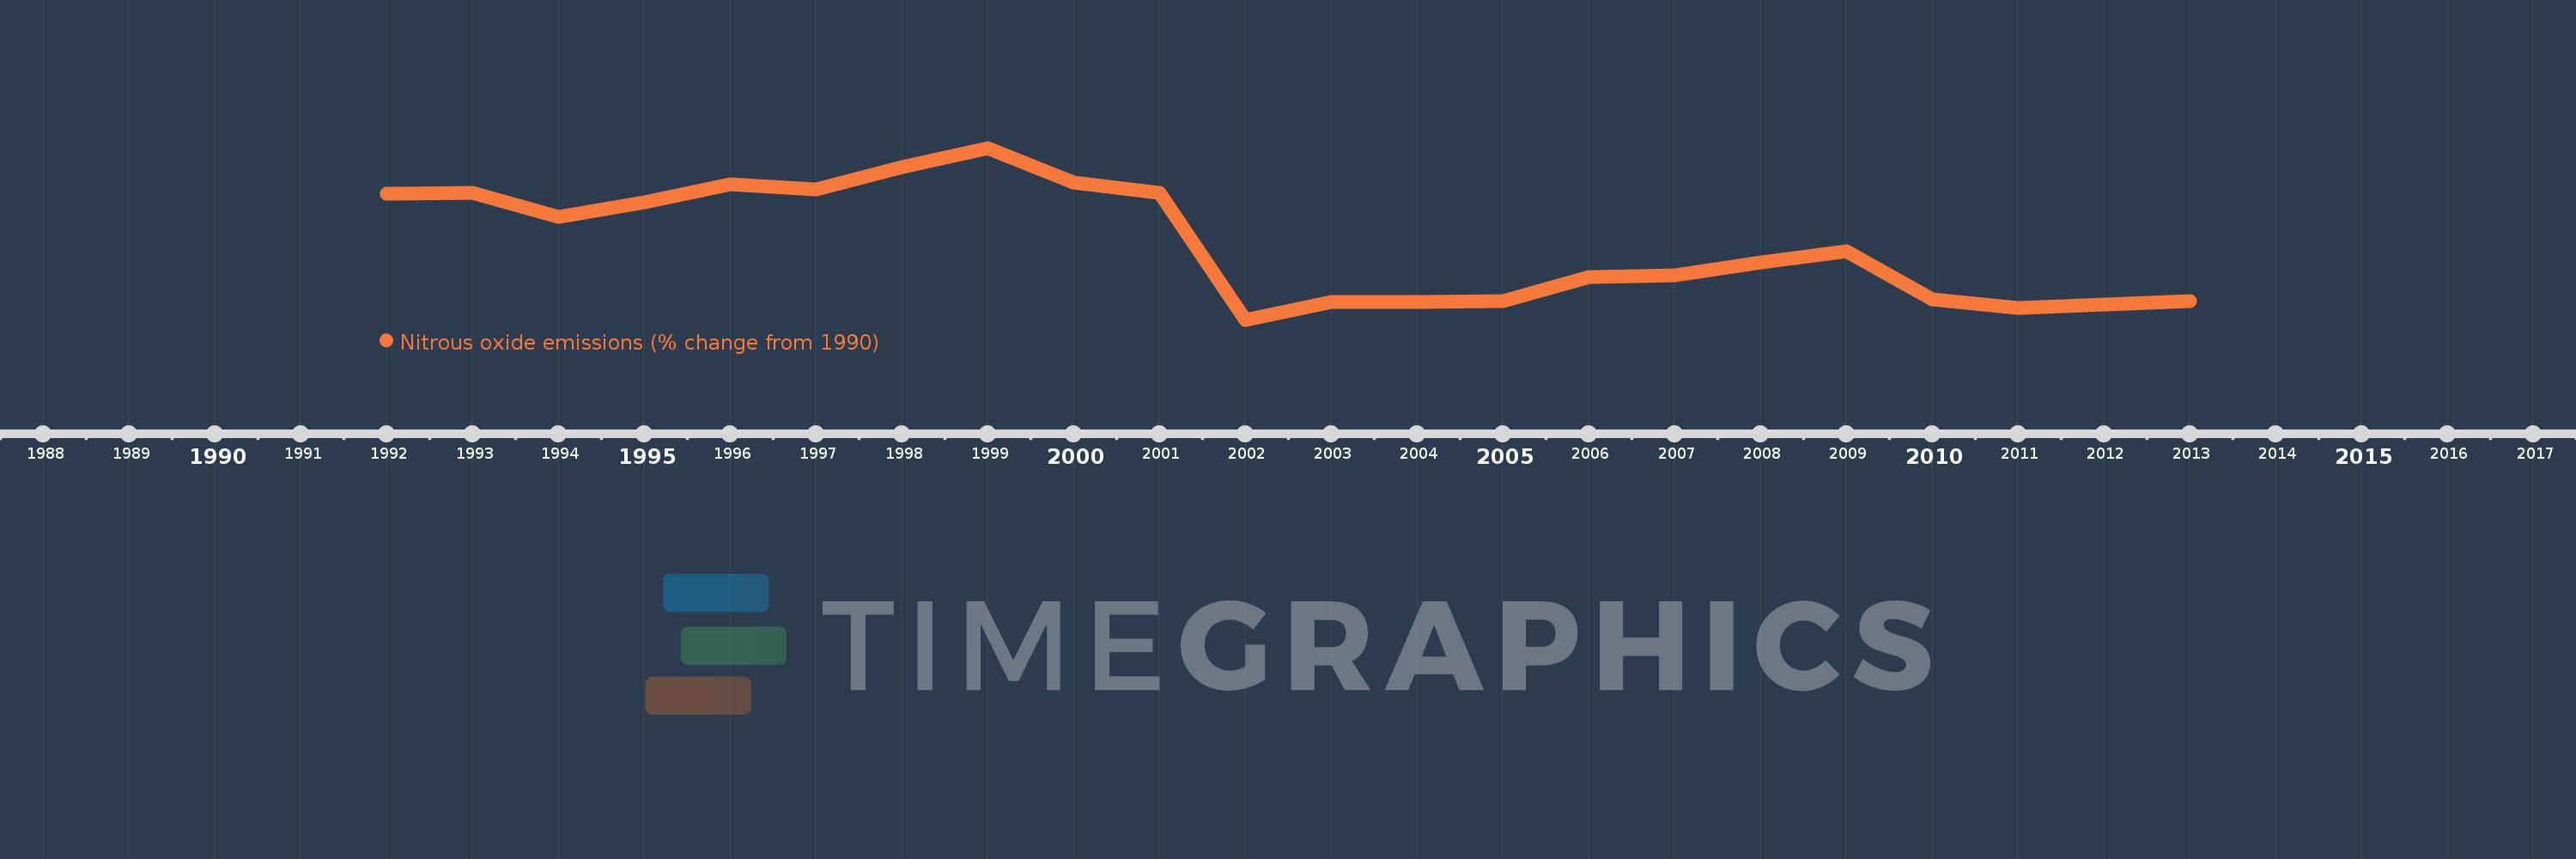
This timeline shows a graph from 1992 to 2013 of Jordan. No data until 1991. Number of actual observations by date: 22.
Source name:
World Development Indicators
Source organization:
World Bank staff estimates from original source: European Commission, Joint Research Centre (JRC)/Netherlands Environmental Assessment Agency (PBL). Emission Database for Global Atmospheric Research (EDGAR): http://edgar.jrc.ec.europa.eu/.
Categories, topics:
Climate Change, Environment
Last updated:
apr 23, 2017
Indicators value changes by year
Meaning:
11.909
Minimum:
-9.153
jan 1, 2002
Maximum:
38.784
jan 1, 1999
At the date of observation
Value
Absolute change
Change from the previous value
jan 1, 1992
26.037
+26.037
0.0%
jan 1, 1993
26.357
+0.32
1.23%
jan 1, 1994
19.584
-6.773
-25.7%
jan 1, 1995
23.708
+4.123
21.05%
jan 1, 1996
28.663
+4.955
20.9%
jan 1, 1997
27.325
-1.338
-4.67%
jan 1, 1998
33.439
+6.114
22.37%
jan 1, 1999
38.784
+5.346
15.99%
jan 1, 2000
29.053
-9.732
-25.09%
jan 1, 2001
26.159
-2.893
-9.96%
jan 1, 2002
-9.153
-35.313
-134.99%
jan 1, 2003
-4.283
+4.87
-53.21%
jan 1, 2004
-4.216
+0.067
-1.56%
jan 1, 2005
-3.938
+0.278
-6.6%
jan 1, 2006
2.864
+6.803
-172.73%
jan 1, 2007
3.186
+0.322
11.24%
jan 1, 2008
6.856
+3.669
115.16%
jan 1, 2009
9.837
+2.981
43.48%
jan 1, 2010
-3.47
-13.307
-135.28%
jan 1, 2011
-5.872
-2.402
69.23%
jan 1, 2012
-4.931
+0.941
-16.03%
jan 1, 2013
-3.989
+0.941
-19.09%
Ranking of countries by current statistics by years