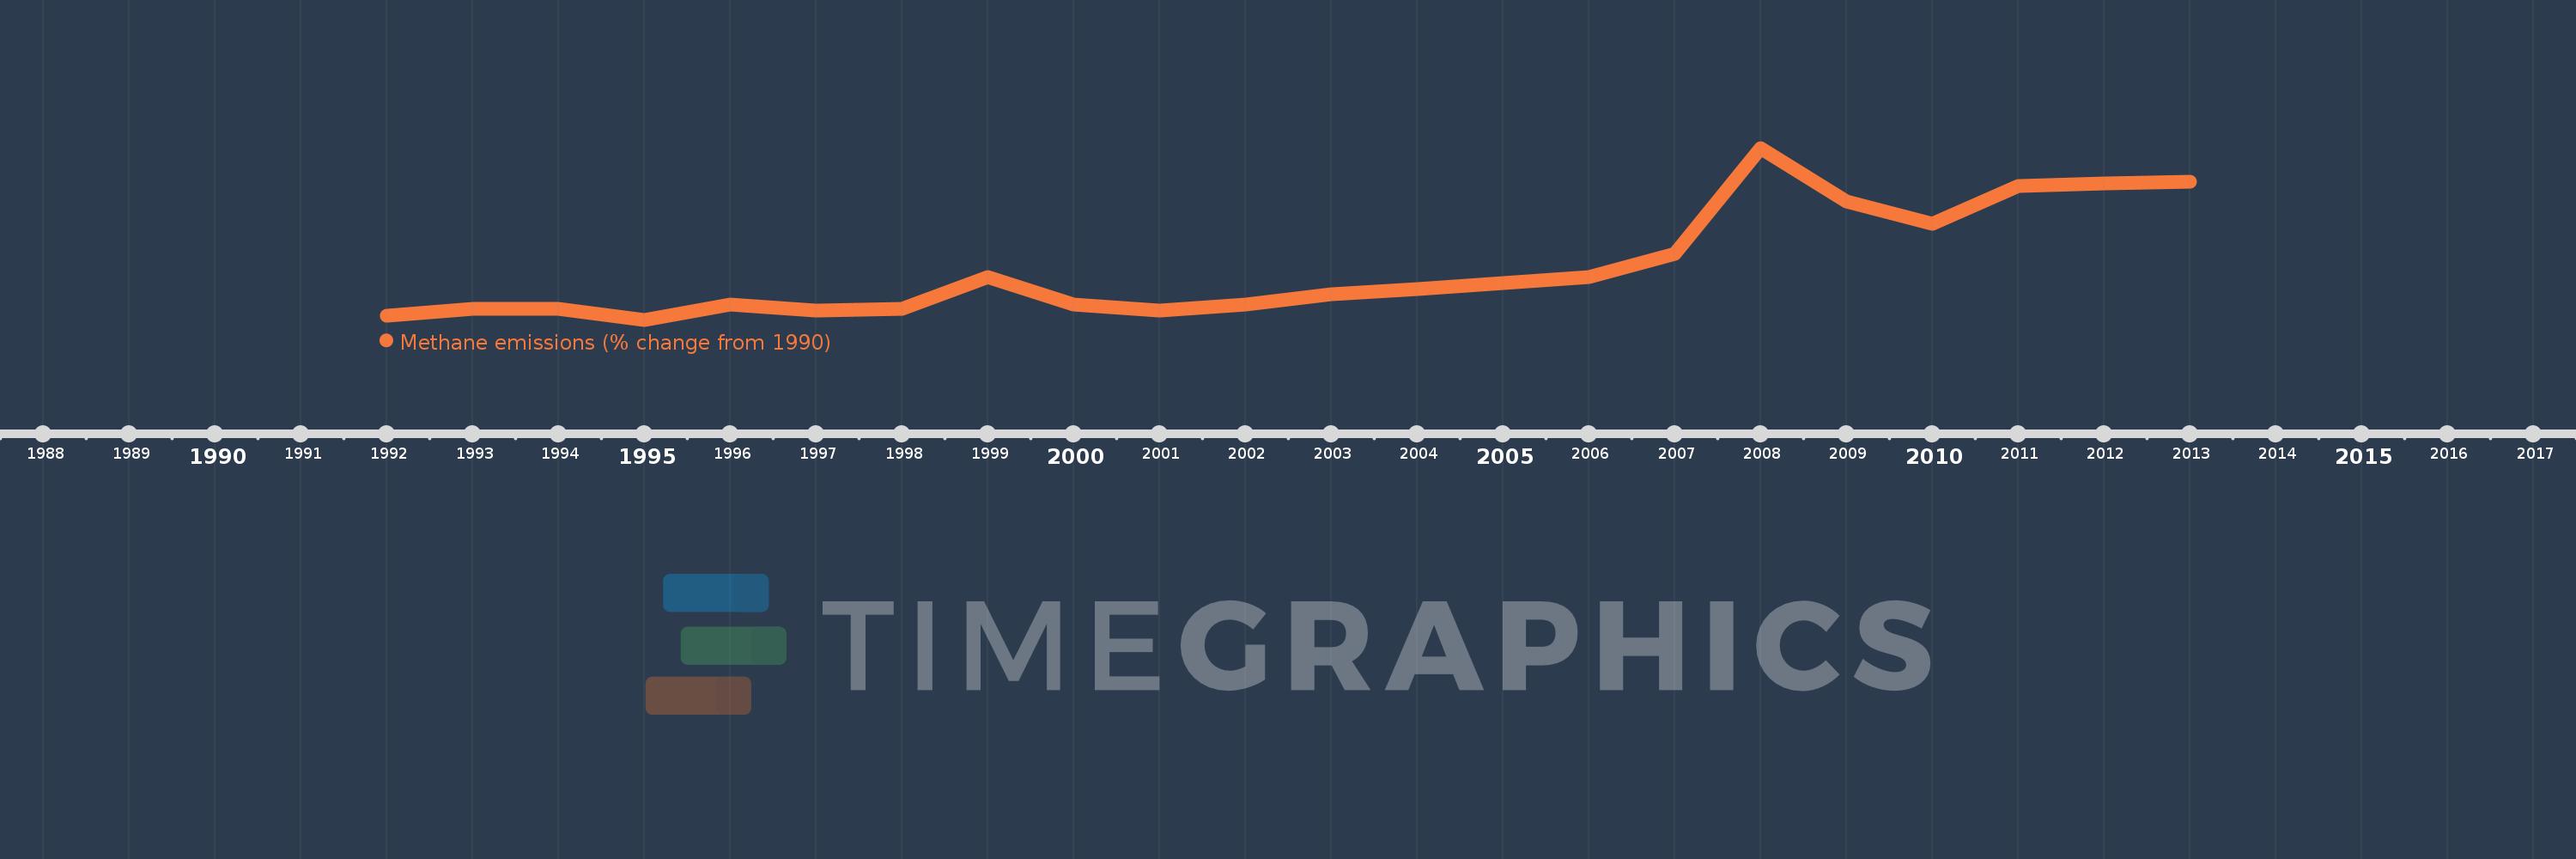
This timeline shows a graph from 1992 to 2013 of Cambodia. No data until 1991. Number of actual observations by date: 22.
Source name:
World Development Indicators
Source organization:
World Bank staff estimates from original source: European Commission, Joint Research Centre (JRC)/Netherlands Environmental Assessment Agency (PBL). Emission Database for Global Atmospheric Research (EDGAR): http://edgar.jrc.ec.europa.eu/.
Categories, topics:
Climate Change, Environment
Last updated:
apr 23, 2017
Indicators value changes by year
Meaning:
45.004
Minimum:
-10.412
jan 1, 1995
Maximum:
173.654
jan 1, 2008
At the date of observation
Value
Absolute change
Change from the previous value
jan 1, 1992
-6.203
-6.203
0.0%
jan 1, 1993
1.19
+7.394
-119.19%
jan 1, 1994
1.347
+0.157
13.17%
jan 1, 1995
-10.412
-11.759
-872.99%
jan 1, 1996
5.653
+16.065
-154.3%
jan 1, 1997
-0.881
-6.534
-115.59%
jan 1, 1998
1.677
+2.558
-290.32%
jan 1, 1999
35.147
+33.47
2.0K%
jan 1, 2000
5.647
-29.5
-83.93%
jan 1, 2001
-0.865
-6.512
-115.32%
jan 1, 2002
5.726
+6.591
-761.7%
jan 1, 2003
17.133
+11.407
199.21%
jan 1, 2004
22.218
+5.085
29.68%
jan 1, 2005
29.131
+6.913
31.12%
jan 1, 2006
35.465
+6.334
21.74%
jan 1, 2007
60.078
+24.613
69.4%
jan 1, 2008
173.654
+113.576
189.05%
jan 1, 2009
116.056
-57.598
-33.17%
jan 1, 2010
92.508
-23.548
-20.29%
jan 1, 2011
132.941
+40.433
43.71%
jan 1, 2012
135.271
+2.329
1.75%
jan 1, 2013
137.6
+2.329
1.72%
Ranking of countries by current statistics by years