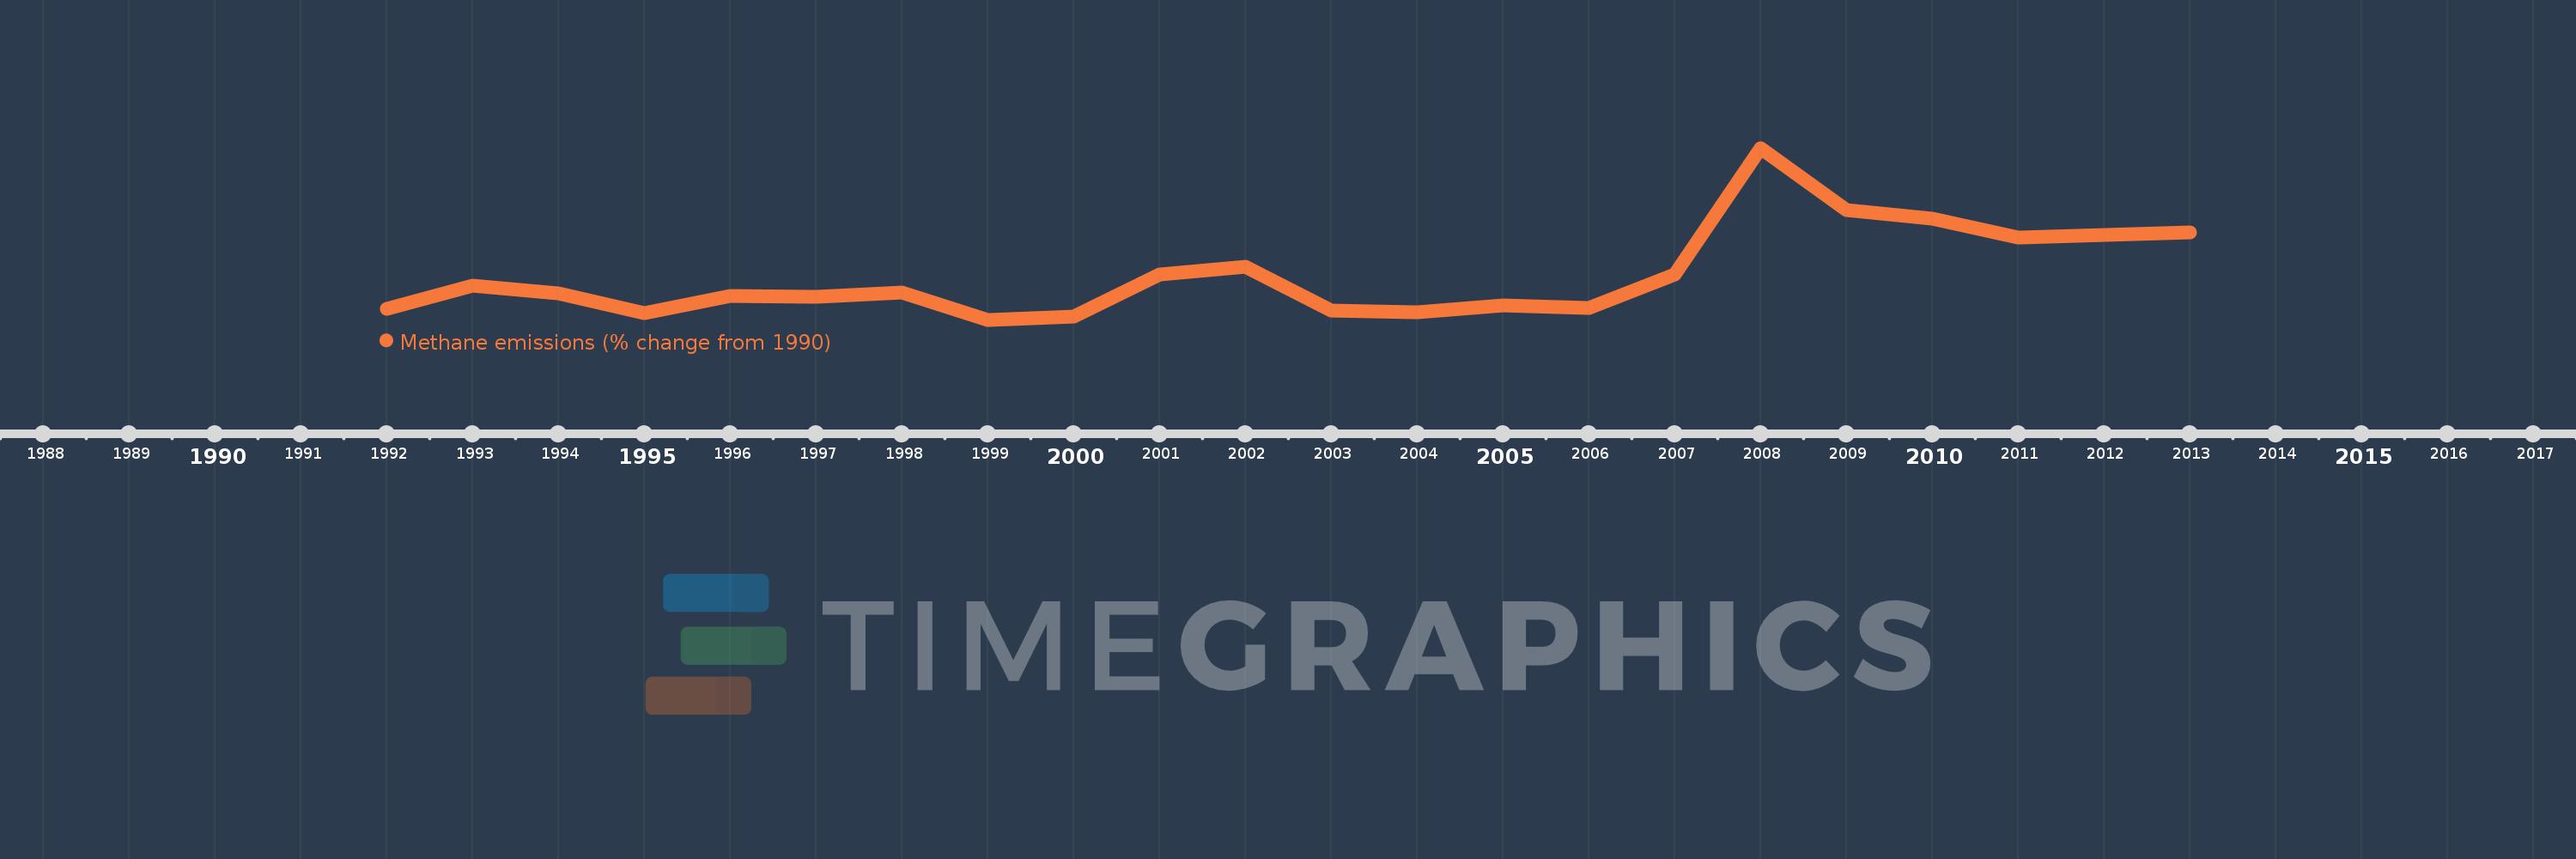
This timeline shows a graph from 1992 to 2013 of Cameroon. No data until 1991. Number of actual observations by date: 22.
Source name:
World Development Indicators
Source organization:
World Bank staff estimates from original source: European Commission, Joint Research Centre (JRC)/Netherlands Environmental Assessment Agency (PBL). Emission Database for Global Atmospheric Research (EDGAR): http://edgar.jrc.ec.europa.eu/.
Categories, topics:
Climate Change, Environment
Last updated:
apr 23, 2017
Indicators value changes by year
Meaning:
-1.249
Minimum:
-18.897
jan 1, 1999
Maximum:
49.151
jan 1, 2008
At the date of observation
Value
Absolute change
Change from the previous value
jan 1, 1992
-14.459
-14.459
0.0%
jan 1, 1993
-5.41
+9.049
-62.58%
jan 1, 1994
-8.376
-2.966
54.83%
jan 1, 1995
-16.216
-7.84
93.6%
jan 1, 1996
-9.473
+6.743
-41.58%
jan 1, 1997
-9.654
-0.181
1.91%
jan 1, 1998
-8.256
+1.397
-14.47%
jan 1, 1999
-18.897
-10.64
128.87%
jan 1, 2000
-17.552
+1.345
-7.12%
jan 1, 2001
-0.859
+16.693
-95.1%
jan 1, 2002
2.029
+2.888
-336.13%
jan 1, 2003
-15.278
-17.307
-853.08%
jan 1, 2004
-15.871
-0.593
3.88%
jan 1, 2005
-13.314
+2.557
-16.11%
jan 1, 2006
-14.272
-0.958
7.2%
jan 1, 2007
-0.8
+13.472
-94.39%
jan 1, 2008
49.151
+49.951
-6.24K%
jan 1, 2009
24.7
-24.451
-49.75%
jan 1, 2010
21.128
-3.572
-14.46%
jan 1, 2011
13.599
-7.529
-35.64%
jan 1, 2012
14.735
+1.136
8.35%
jan 1, 2013
15.871
+1.136
7.71%
Ranking of countries by current statistics by years