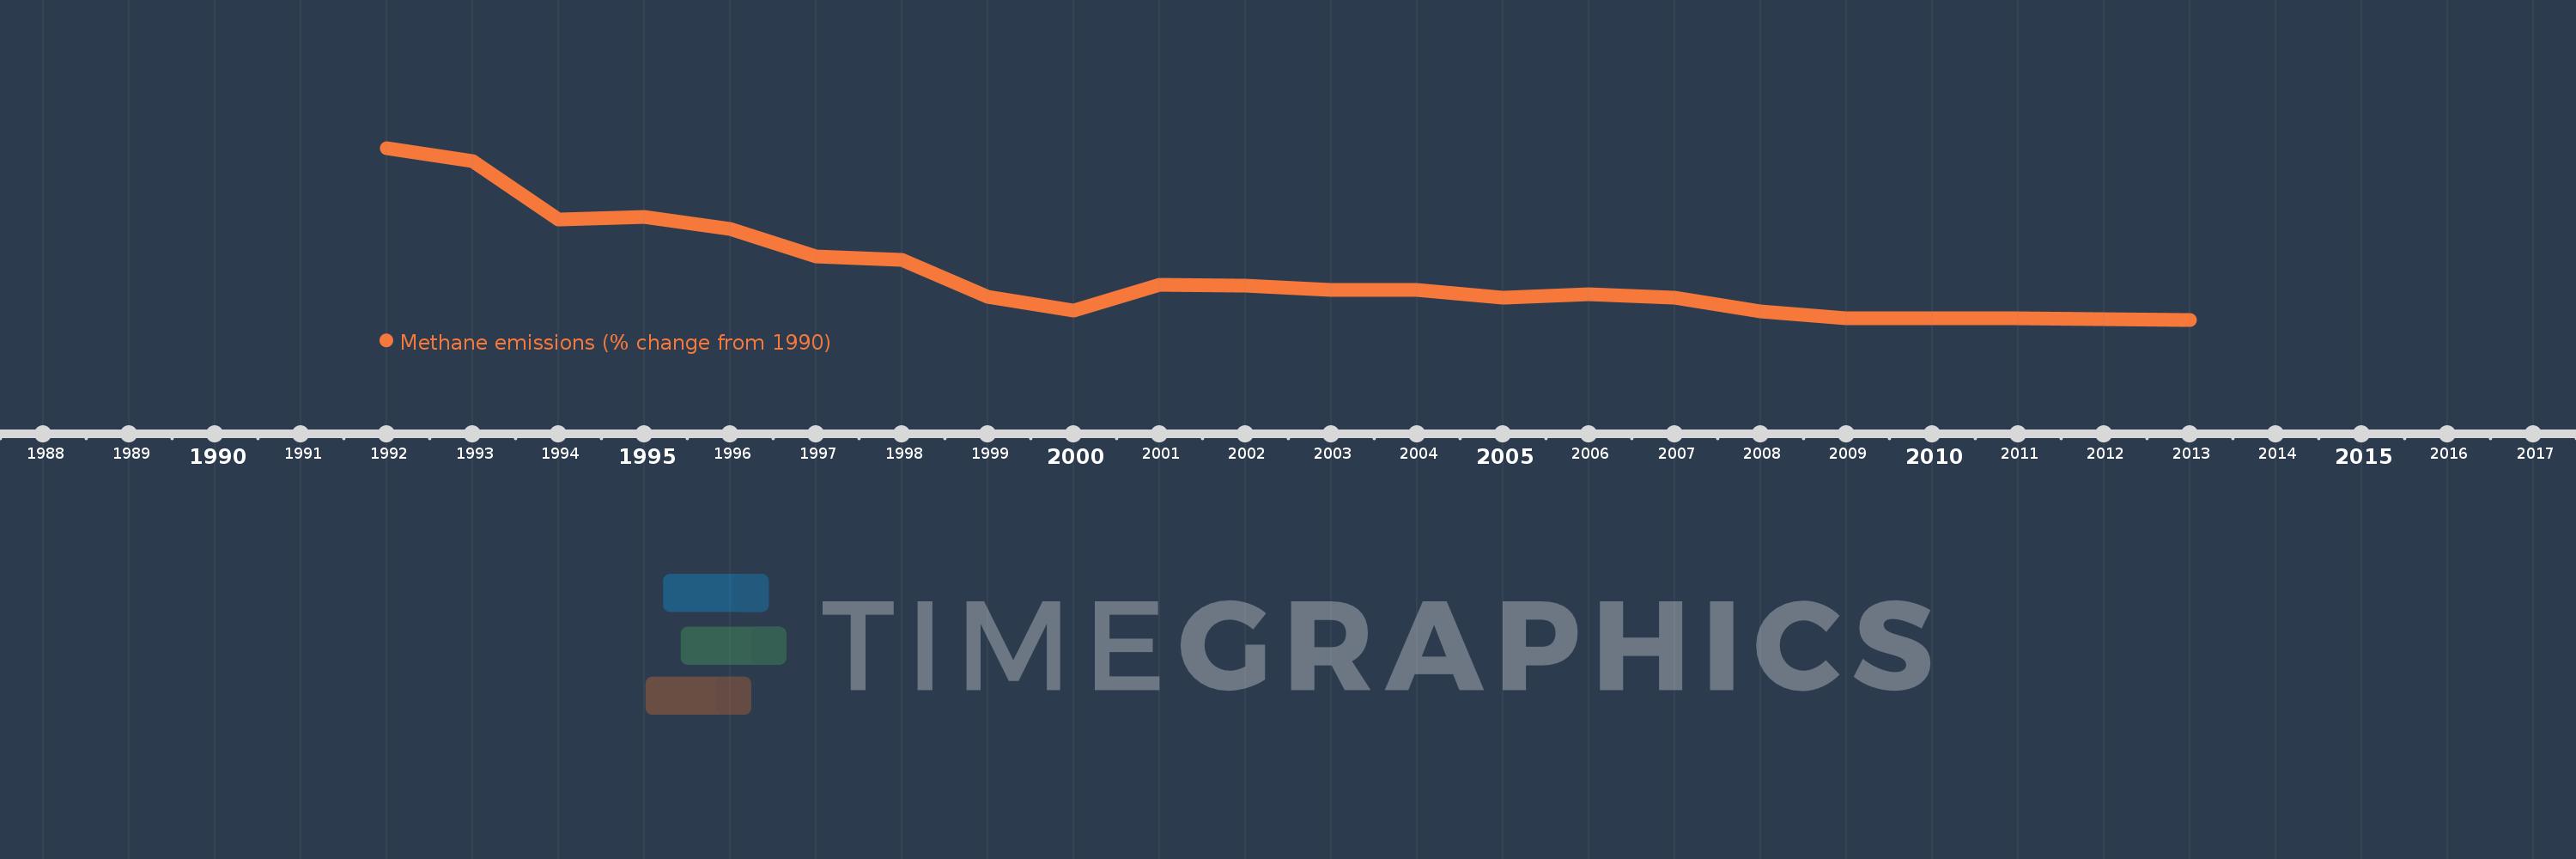
This timeline shows a graph from 1992 to 2013 of Poland. No data until 1991. Number of actual observations by date: 22.
Source name:
World Development Indicators
Source organization:
World Bank staff estimates from original source: European Commission, Joint Research Centre (JRC)/Netherlands Environmental Assessment Agency (PBL). Emission Database for Global Atmospheric Research (EDGAR): http://edgar.jrc.ec.europa.eu/.
Categories, topics:
Climate Change, Environment
Last updated:
apr 23, 2017
Indicators value changes by year
Meaning:
-30.35
Minimum:
-39.531
jan 1, 2013
Maximum:
-4.573
jan 1, 1992
At the date of observation
Value
Absolute change
Change from the previous value
jan 1, 1992
-4.573
-4.573
0.0%
jan 1, 1993
-7.253
-2.68
58.6%
jan 1, 1994
-19.141
-11.888
163.92%
jan 1, 1995
-18.614
+0.527
-2.76%
jan 1, 1996
-20.981
-2.367
12.72%
jan 1, 1997
-26.568
-5.587
26.63%
jan 1, 1998
-27.266
-0.698
2.63%
jan 1, 1999
-34.905
-7.64
28.02%
jan 1, 2000
-37.665
-2.759
7.91%
jan 1, 2001
-32.355
+5.31
-14.1%
jan 1, 2002
-32.654
-0.299
0.93%
jan 1, 2003
-33.381
-0.727
2.23%
jan 1, 2004
-33.481
-0.1
0.3%
jan 1, 2005
-35.011
-1.53
4.57%
jan 1, 2006
-34.393
+0.618
-1.77%
jan 1, 2007
-35.012
-0.619
1.8%
jan 1, 2008
-37.821
-2.809
8.02%
jan 1, 2009
-39.221
-1.4
3.7%
jan 1, 2010
-39.3
-0.079
0.2%
jan 1, 2011
-39.156
+0.144
-0.37%
jan 1, 2012
-39.416
-0.26
0.66%
jan 1, 2013
-39.531
-0.115
0.29%
Ranking of countries by current statistics by years