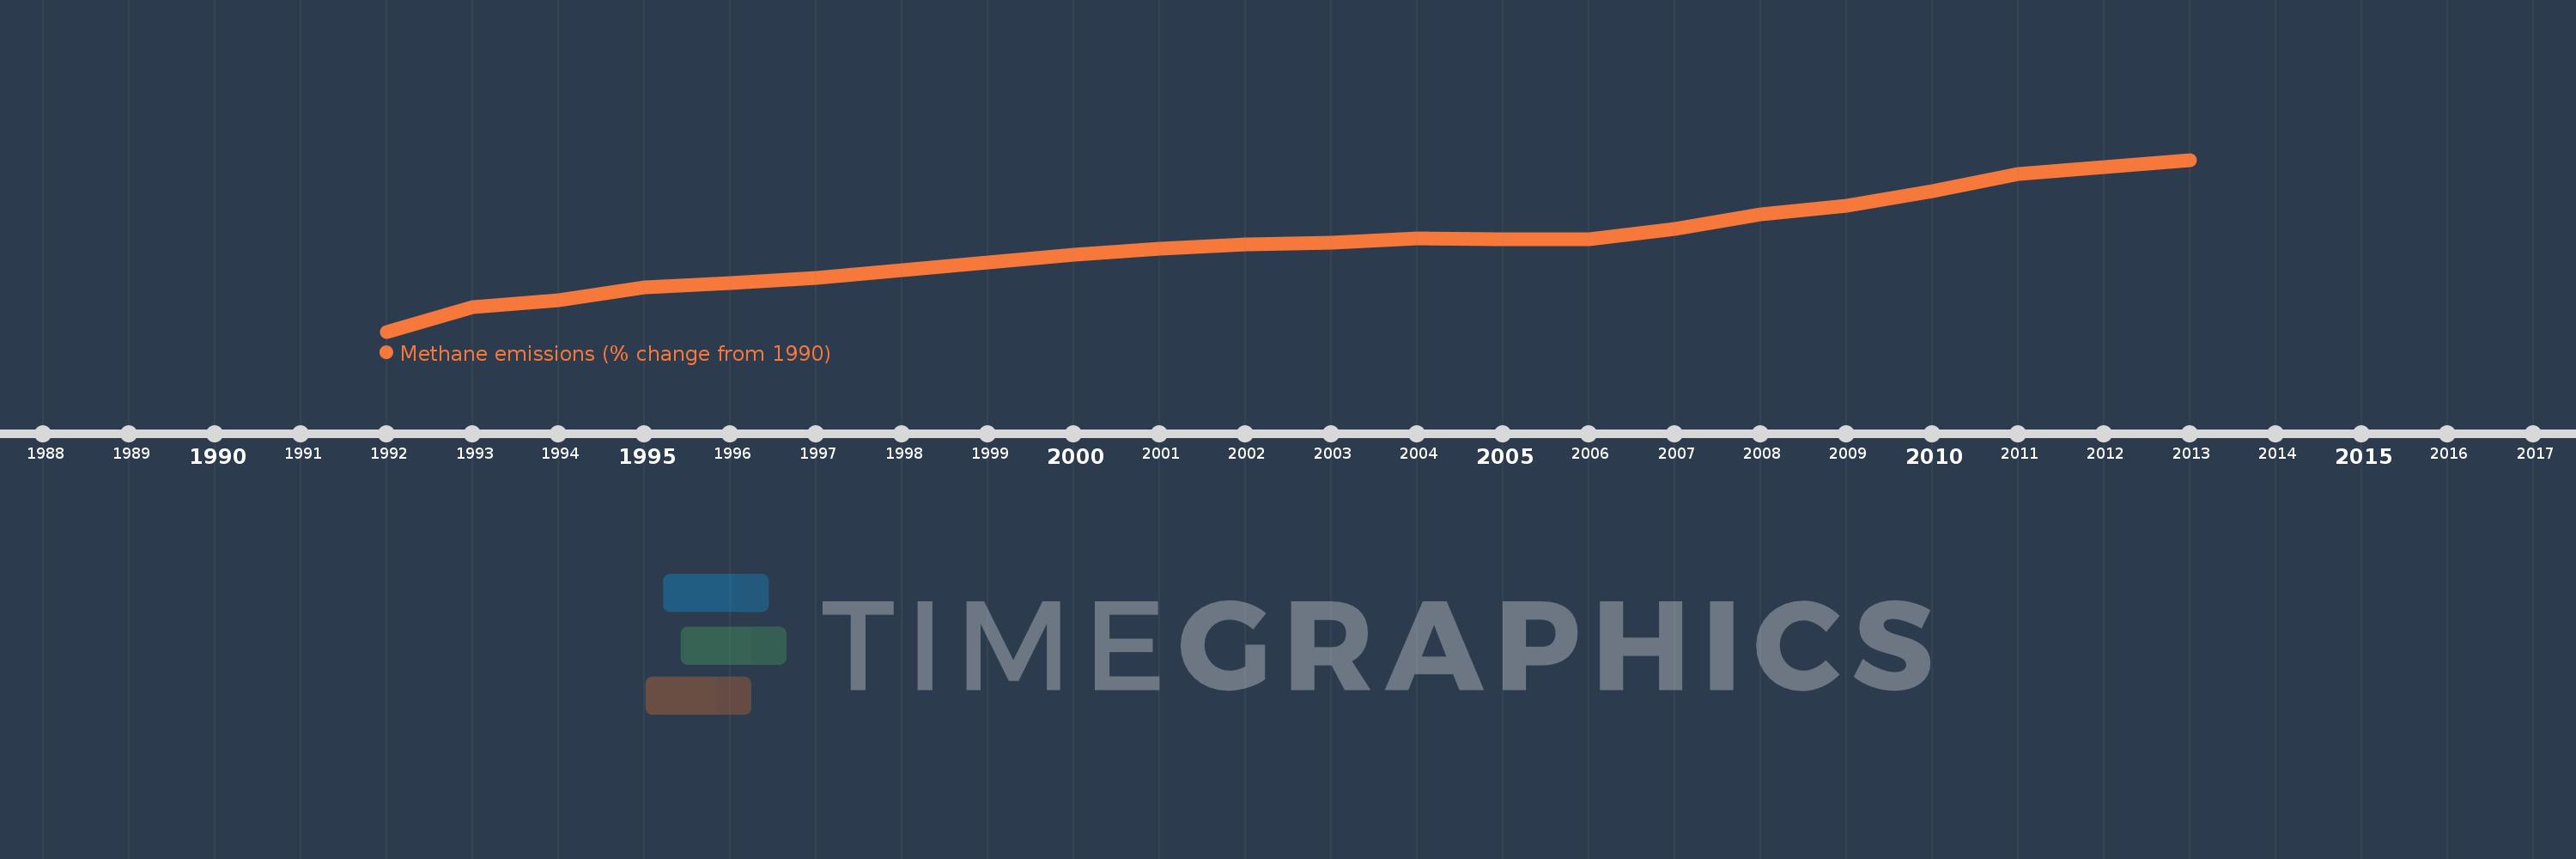
This timeline shows a graph from 1992 to 2013 of Gibraltar. No data until 1991. Number of actual observations by date: 22.
Source name:
World Development Indicators
Source organization:
World Bank staff estimates from original source: European Commission, Joint Research Centre (JRC)/Netherlands Environmental Assessment Agency (PBL). Emission Database for Global Atmospheric Research (EDGAR): http://edgar.jrc.ec.europa.eu/.
Categories, topics:
Climate Change, Environment
Last updated:
apr 23, 2017
Indicators value changes by year
Meaning:
19.343
Minimum:
2.854
jan 1, 1992
Maximum:
35.221
jan 1, 2013
At the date of observation
Value
Absolute change
Change from the previous value
jan 1, 1992
2.854
+2.854
0.0%
jan 1, 1993
7.53
+4.676
163.85%
jan 1, 1994
8.769
+1.239
16.45%
jan 1, 1995
11.209
+2.44
27.83%
jan 1, 1996
12.055
+0.846
7.55%
jan 1, 1997
12.916
+0.861
7.15%
jan 1, 1998
14.376
+1.46
11.3%
jan 1, 1999
15.871
+1.494
10.39%
jan 1, 2000
17.263
+1.393
8.78%
jan 1, 2001
18.547
+1.283
7.43%
jan 1, 2002
19.287
+0.74
3.99%
jan 1, 2003
19.545
+0.257
1.33%
jan 1, 2004
20.335
+0.791
4.04%
jan 1, 2005
20.232
-0.103
-0.51%
jan 1, 2006
20.285
+0.053
0.26%
jan 1, 2007
22.157
+1.871
9.23%
jan 1, 2008
24.873
+2.716
12.26%
jan 1, 2009
26.493
+1.62
6.51%
jan 1, 2010
29.256
+2.764
10.43%
jan 1, 2011
32.57
+3.314
11.33%
jan 1, 2012
33.896
+1.326
4.07%
jan 1, 2013
35.221
+1.326
3.91%
Ranking of countries by current statistics by years