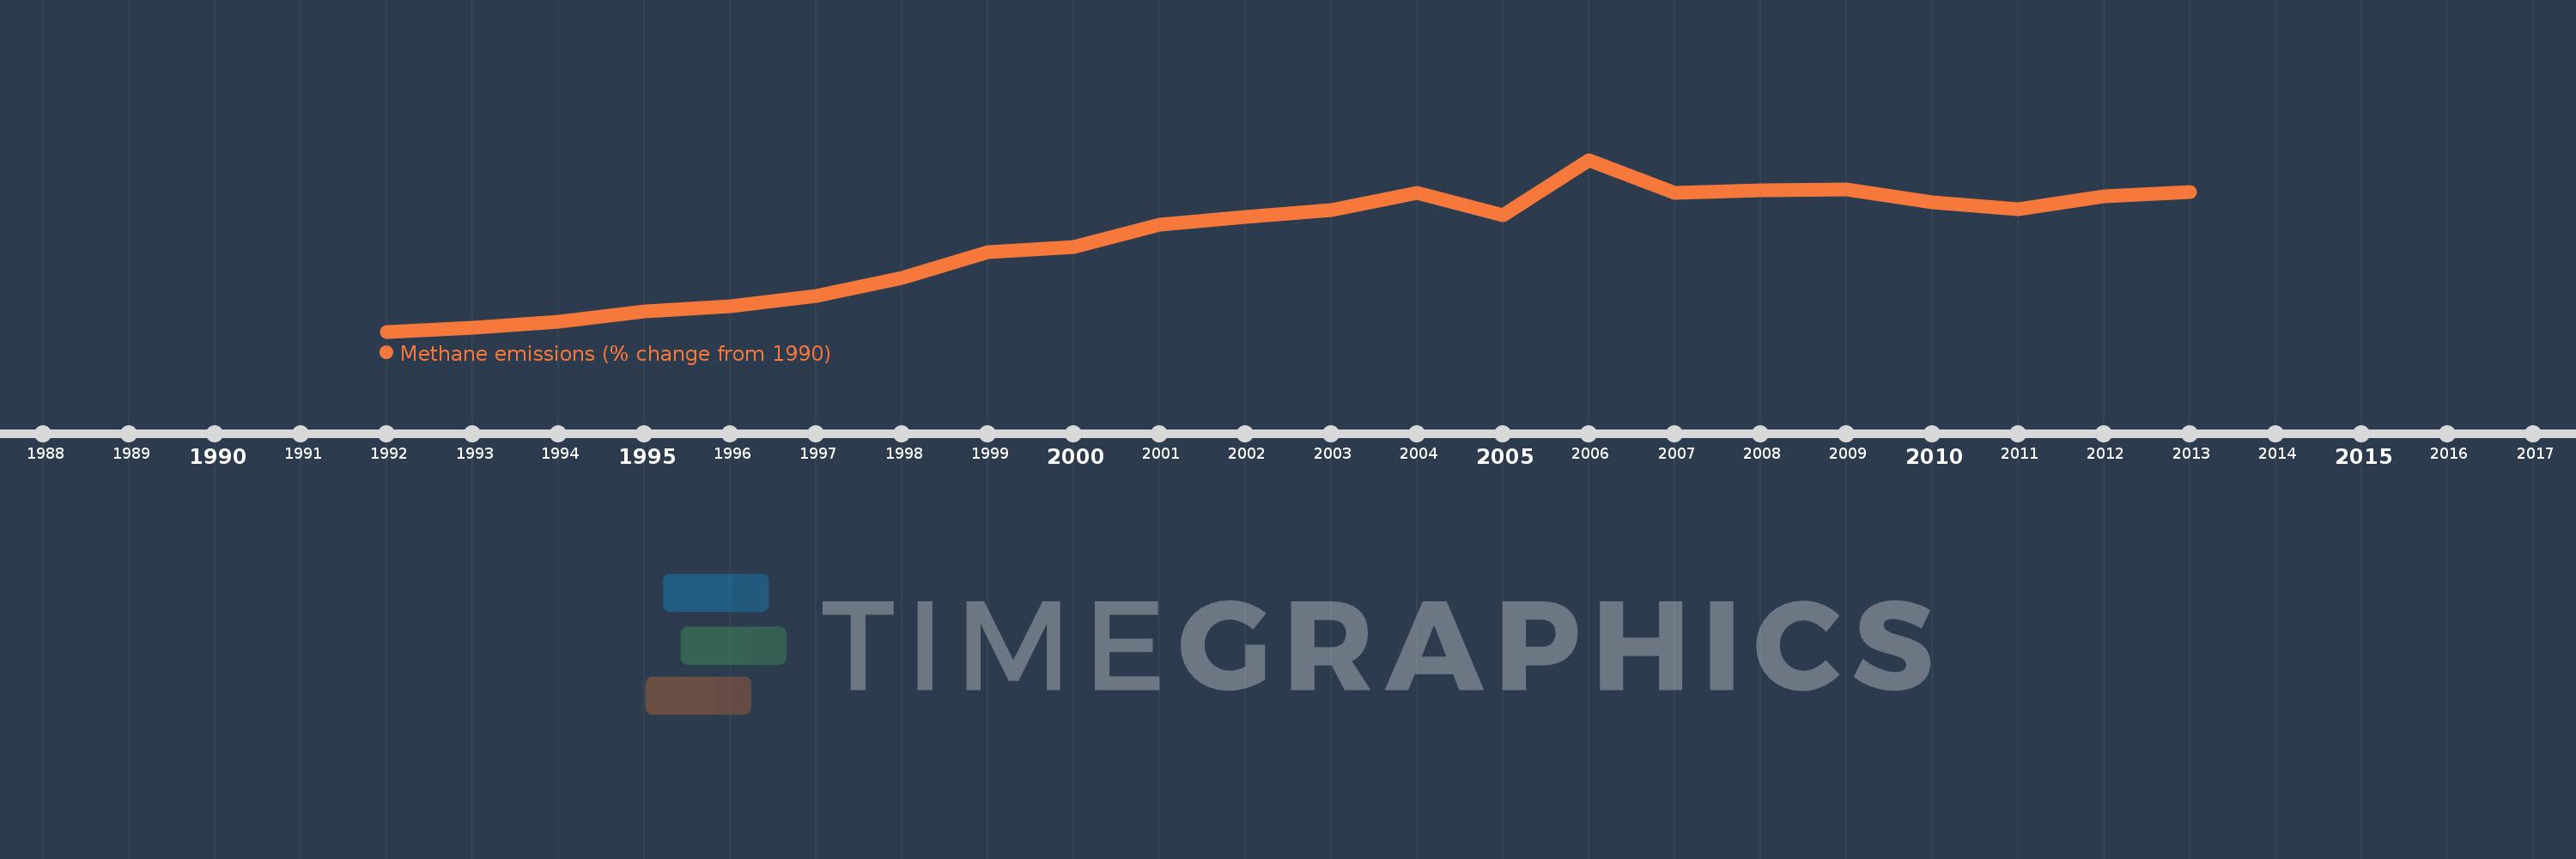
This timeline shows a graph from 1992 to 2013 of Portugal. No data until 1991. Number of actual observations by date: 22.
Source name:
World Development Indicators
Source organization:
World Bank staff estimates from original source: European Commission, Joint Research Centre (JRC)/Netherlands Environmental Assessment Agency (PBL). Emission Database for Global Atmospheric Research (EDGAR): http://edgar.jrc.ec.europa.eu/.
Categories, topics:
Climate Change, Environment
Last updated:
apr 23, 2017
Indicators value changes by year
Meaning:
21.395
Minimum:
1.692
jan 1, 1992
Maximum:
38.306
jan 1, 2006
At the date of observation
Value
Absolute change
Change from the previous value
jan 1, 1992
1.692
+1.692
0.0%
jan 1, 1993
2.55
+0.858
50.74%
jan 1, 1994
3.858
+1.307
51.27%
jan 1, 1995
5.948
+2.091
54.2%
jan 1, 1996
7.136
+1.188
19.97%
jan 1, 1997
9.326
+2.19
30.69%
jan 1, 1998
13.143
+3.817
40.92%
jan 1, 1999
18.69
+5.547
42.2%
jan 1, 2000
19.647
+0.957
5.12%
jan 1, 2001
24.555
+4.908
24.98%
jan 1, 2002
26.176
+1.621
6.6%
jan 1, 2003
27.631
+1.455
5.56%
jan 1, 2004
31.247
+3.616
13.09%
jan 1, 2005
26.475
-4.773
-15.27%
jan 1, 2006
38.306
+11.831
44.69%
jan 1, 2007
31.337
-6.969
-18.19%
jan 1, 2008
31.865
+0.528
1.69%
jan 1, 2009
32.056
+0.192
0.6%
jan 1, 2010
29.295
-2.761
-8.61%
jan 1, 2011
27.691
-1.604
-5.48%
jan 1, 2012
30.551
+2.859
10.33%
jan 1, 2013
31.512
+0.962
3.15%
Ranking of countries by current statistics by years