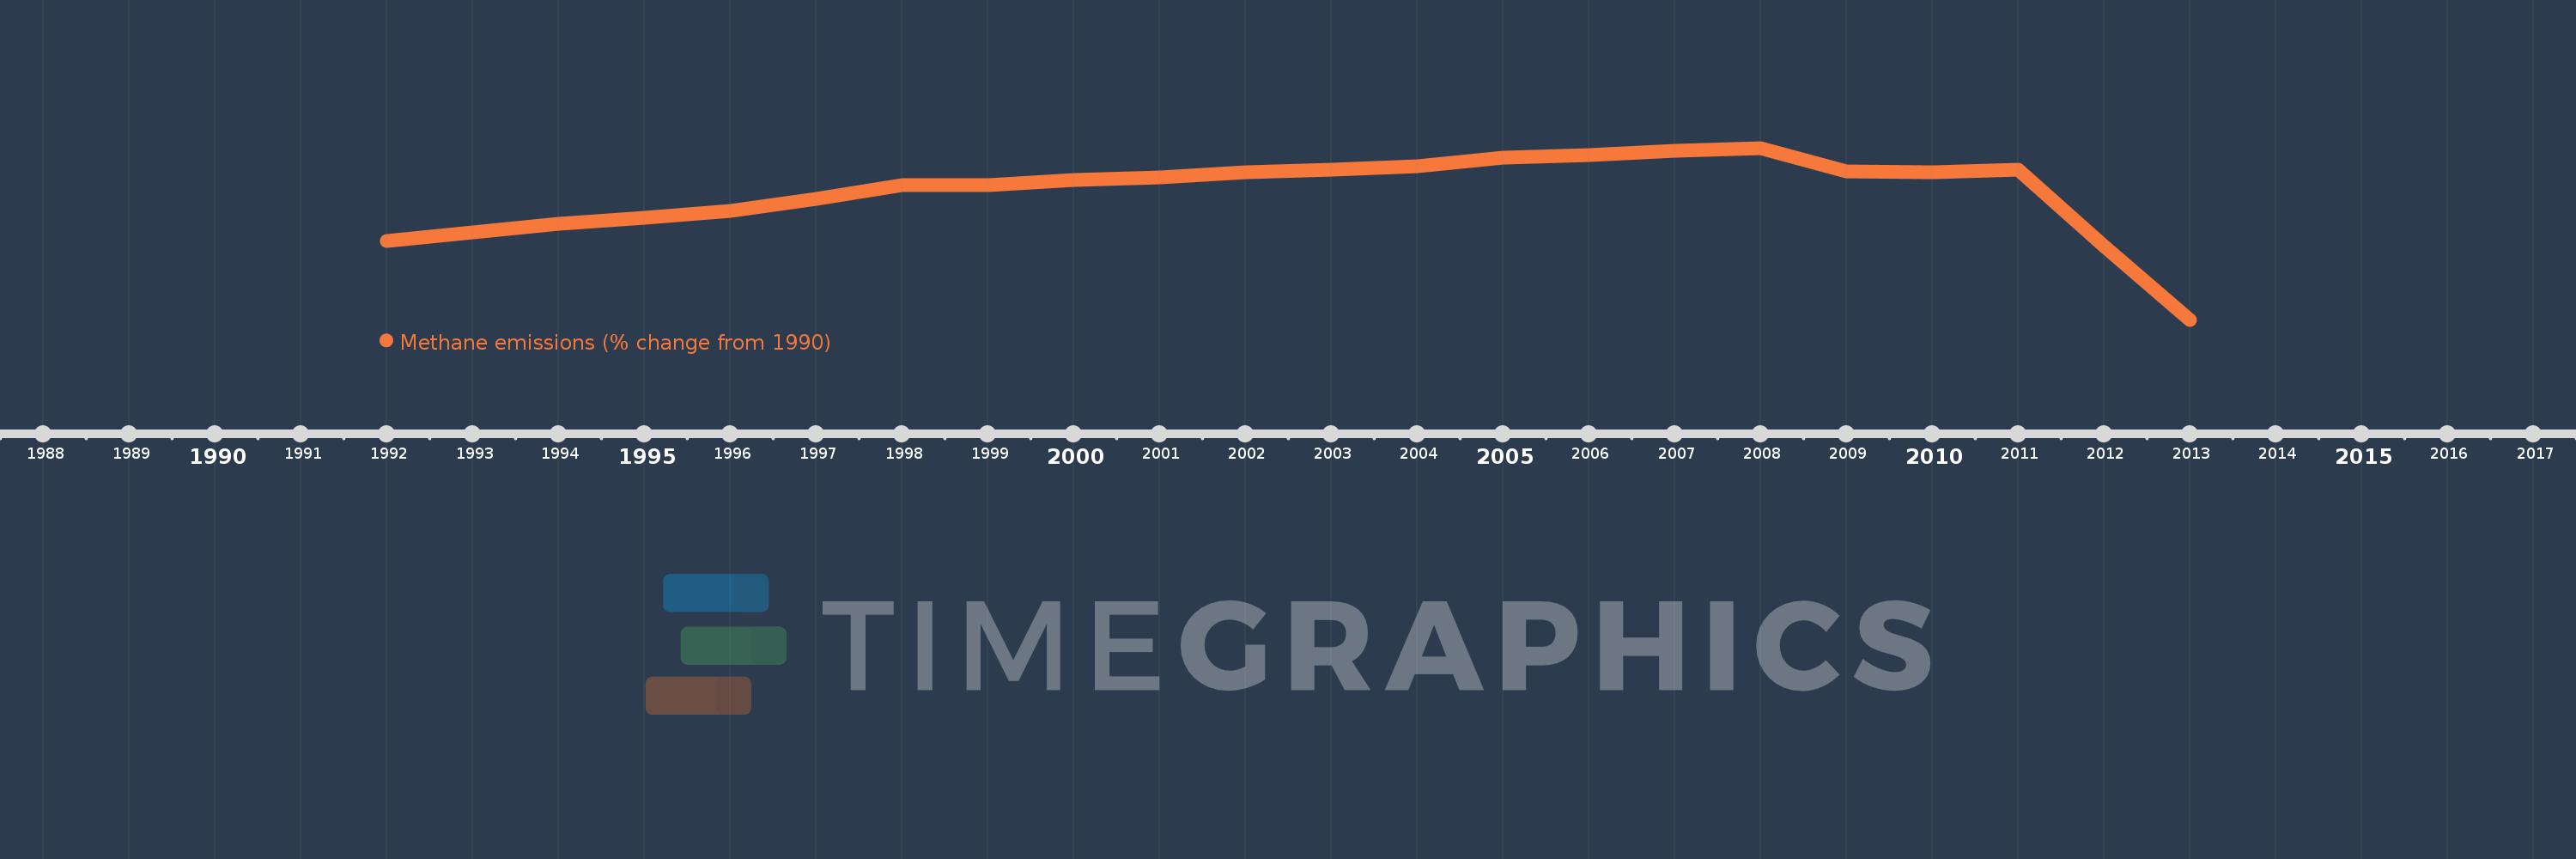
This timeline shows a graph from 1992 to 2013 of Malta. No data until 1991. Number of actual observations by date: 22.
Source name:
World Development Indicators
Source organization:
World Bank staff estimates from original source: European Commission, Joint Research Centre (JRC)/Netherlands Environmental Assessment Agency (PBL). Emission Database for Global Atmospheric Research (EDGAR): http://edgar.jrc.ec.europa.eu/.
Categories, topics:
Climate Change, Environment
Last updated:
apr 23, 2017
Indicators value changes by year
Meaning:
20.142
Minimum:
-23.151
jan 1, 2013
Maximum:
35.659
jan 1, 2008
At the date of observation
Value
Absolute change
Change from the previous value
jan 1, 1992
3.743
+3.743
0.0%
jan 1, 1993
6.654
+2.911
77.78%
jan 1, 1994
9.614
+2.961
44.5%
jan 1, 1995
11.766
+2.152
22.38%
jan 1, 1996
14.097
+2.331
19.81%
jan 1, 1997
18.323
+4.226
29.98%
jan 1, 1998
22.792
+4.469
24.39%
jan 1, 1999
22.78
-0.012
-0.05%
jan 1, 2000
24.725
+1.944
8.54%
jan 1, 2001
25.537
+0.812
3.28%
jan 1, 2002
27.271
+1.734
6.79%
jan 1, 2003
28.224
+0.953
3.49%
jan 1, 2004
29.25
+1.026
3.64%
jan 1, 2005
32.407
+3.157
10.79%
jan 1, 2006
33.221
+0.814
2.51%
jan 1, 2007
34.766
+1.545
4.65%
jan 1, 2008
35.659
+0.893
2.57%
jan 1, 2009
27.655
-8.003
-22.44%
jan 1, 2010
27.41
-0.246
-0.89%
jan 1, 2011
28.257
+0.847
3.09%
jan 1, 2012
2.129
-26.128
-92.46%
jan 1, 2013
-23.151
-25.281
-1.19K%
Ranking of countries by current statistics by years