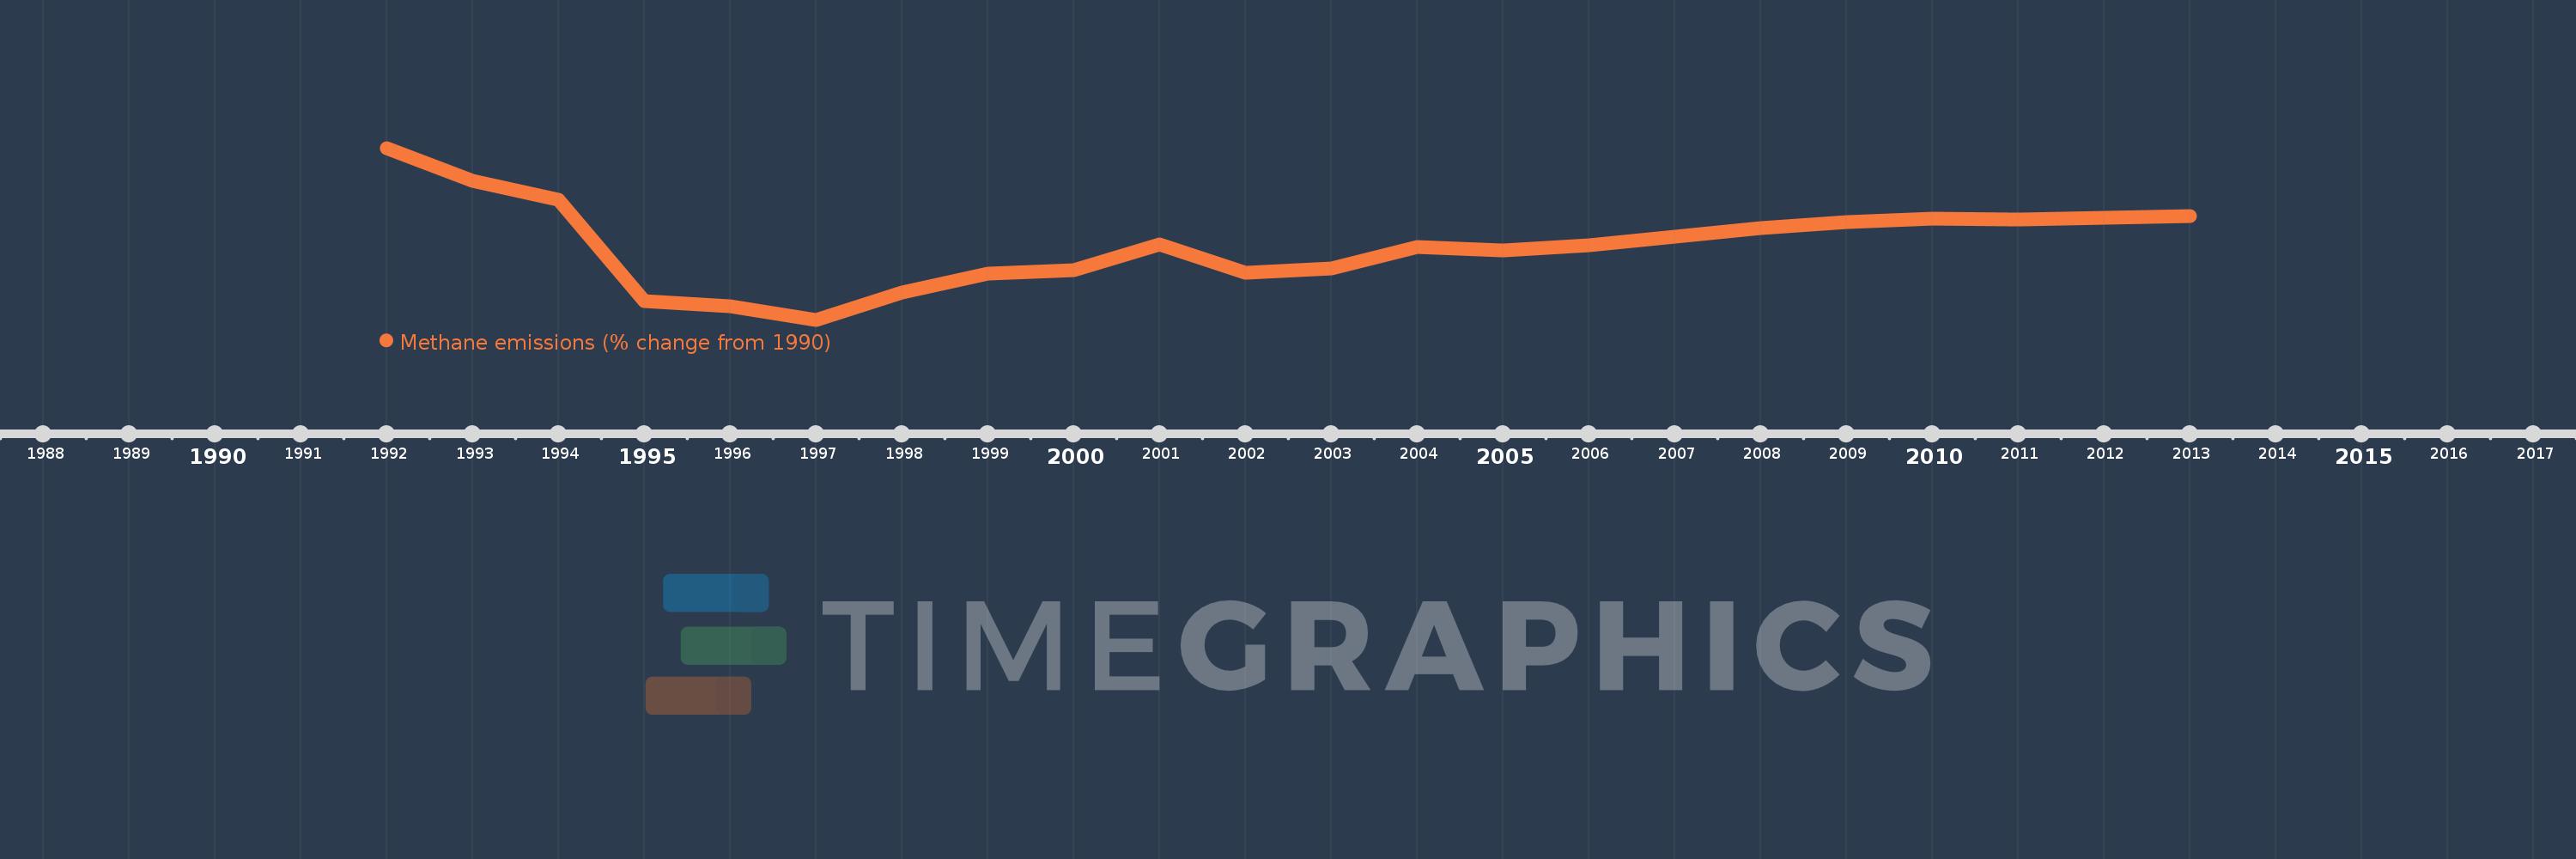
This timeline shows a graph from 1992 to 2013 of Bosnia and Herzegovina. No data until 1991. Number of actual observations by date: 22.
Source name:
World Development Indicators
Source organization:
World Bank staff estimates from original source: European Commission, Joint Research Centre (JRC)/Netherlands Environmental Assessment Agency (PBL). Emission Database for Global Atmospheric Research (EDGAR): http://edgar.jrc.ec.europa.eu/.
Categories, topics:
Climate Change, Environment
Last updated:
apr 23, 2017
Indicators value changes by year
Meaning:
-41.736
Minimum:
-68.508
jan 1, 1997
Maximum:
-7.378
jan 1, 1992
At the date of observation
Value
Absolute change
Change from the previous value
jan 1, 1992
-7.378
-7.378
0.0%
jan 1, 1993
-19.059
-11.681
158.31%
jan 1, 1994
-25.685
-6.625
34.76%
jan 1, 1995
-61.907
-36.222
141.03%
jan 1, 1996
-63.744
-1.837
2.97%
jan 1, 1997
-68.508
-4.764
7.47%
jan 1, 1998
-58.842
+9.666
-14.11%
jan 1, 1999
-52.209
+6.633
-11.27%
jan 1, 2000
-50.894
+1.315
-2.52%
jan 1, 2001
-41.787
+9.107
-17.89%
jan 1, 2002
-51.701
-9.913
23.72%
jan 1, 2003
-50.19
+1.51
-2.92%
jan 1, 2004
-42.571
+7.619
-15.18%
jan 1, 2005
-43.781
-1.21
2.84%
jan 1, 2006
-41.918
+1.863
-4.26%
jan 1, 2007
-38.952
+2.966
-7.08%
jan 1, 2008
-35.841
+3.111
-7.99%
jan 1, 2009
-33.817
+2.024
-5.65%
jan 1, 2010
-32.652
+1.165
-3.45%
jan 1, 2011
-32.92
-0.268
0.82%
jan 1, 2012
-32.249
+0.671
-2.04%
jan 1, 2013
-31.578
+0.671
-2.08%
Ranking of countries by current statistics by years