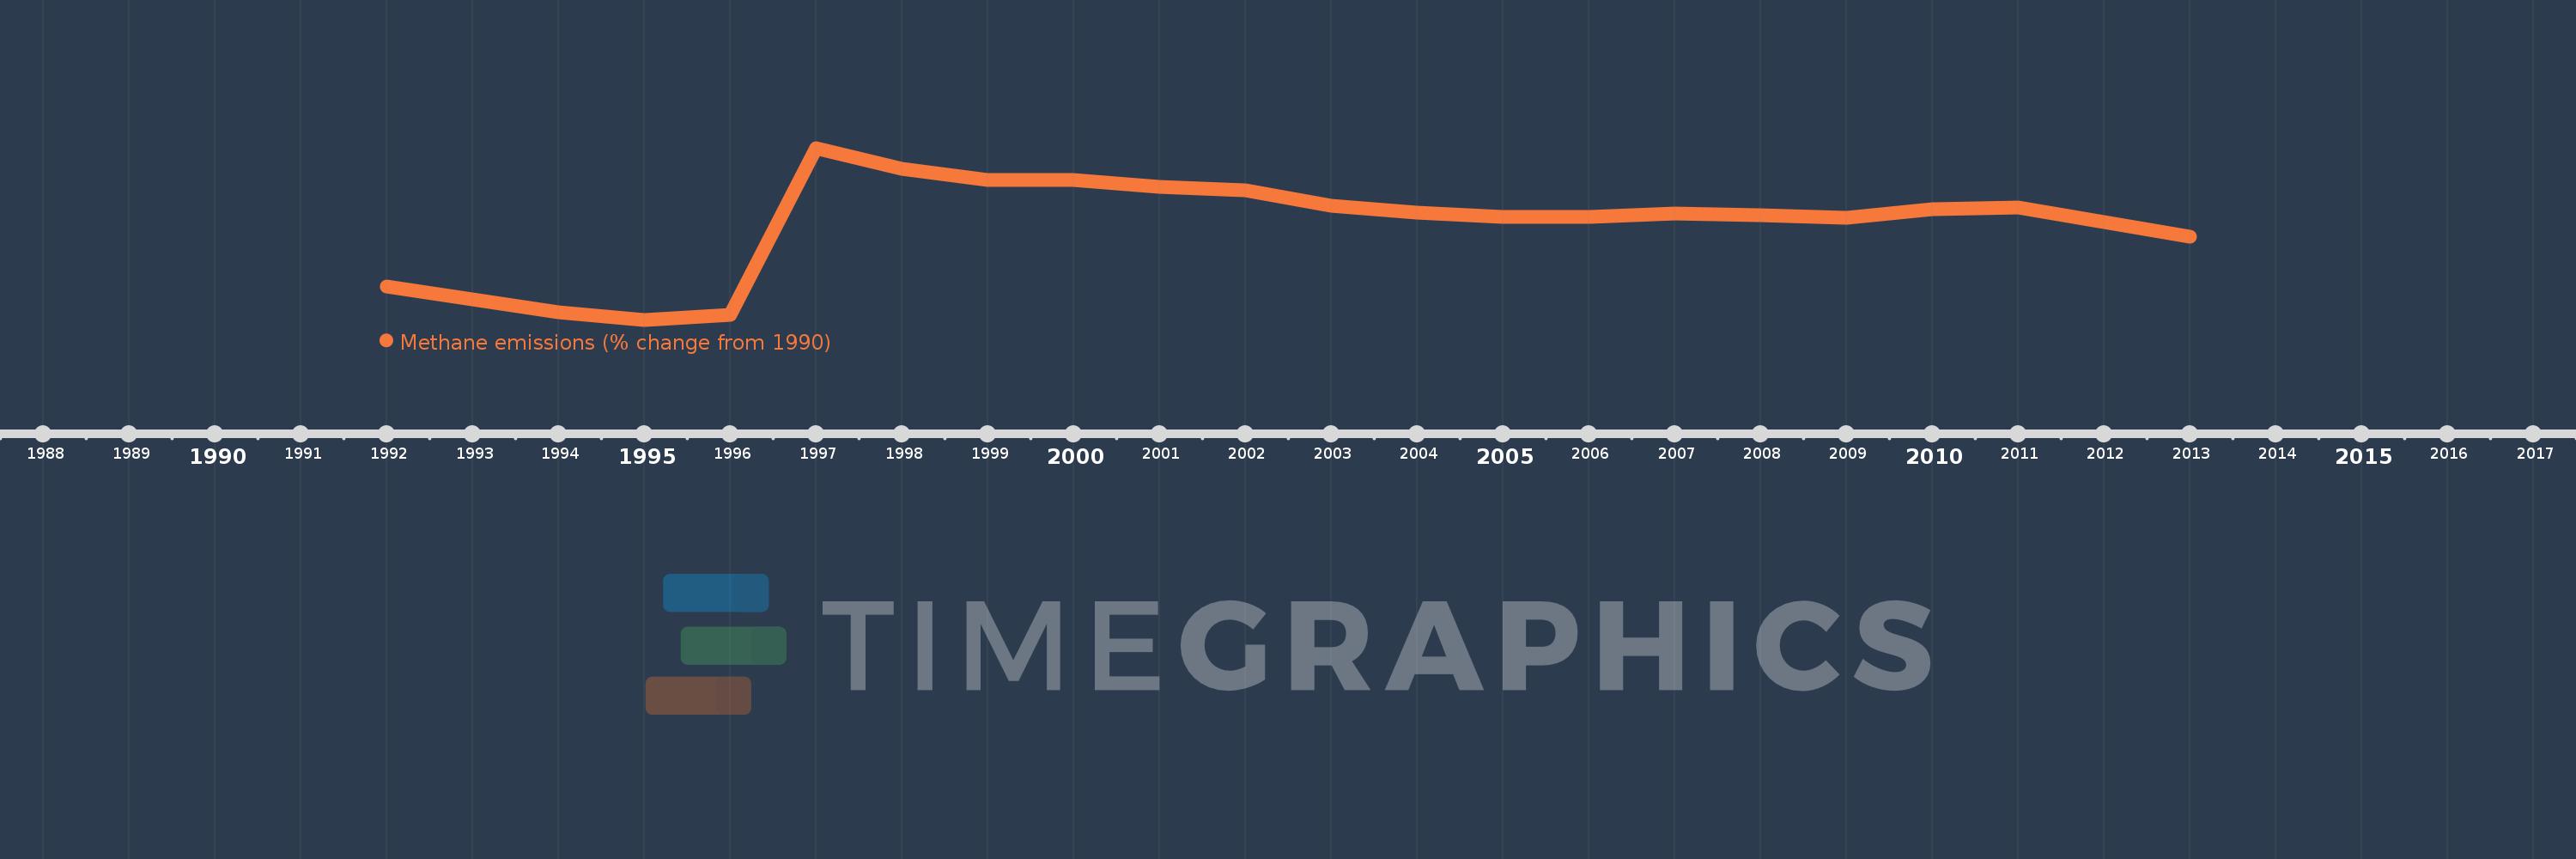
This timeline shows a graph from 1992 to 2013 of France. No data until 1991. Number of actual observations by date: 22.
Source name:
World Development Indicators
Source organization:
World Bank staff estimates from original source: European Commission, Joint Research Centre (JRC)/Netherlands Environmental Assessment Agency (PBL). Emission Database for Global Atmospheric Research (EDGAR): http://edgar.jrc.ec.europa.eu/.
Categories, topics:
Climate Change, Environment
Last updated:
apr 23, 2017
Indicators value changes by year
Meaning:
8.485
Minimum:
-2.634
jan 1, 1995
Maximum:
17.617
jan 1, 1997
At the date of observation
Value
Absolute change
Change from the previous value
jan 1, 1992
1.313
+1.313
0.0%
jan 1, 1993
-0.221
-1.534
-116.84%
jan 1, 1994
-1.748
-1.527
691.04%
jan 1, 1995
-2.634
-0.885
50.65%
jan 1, 1996
-2.013
+0.621
-23.58%
jan 1, 1997
17.617
+19.629
-975.34%
jan 1, 1998
15.174
-2.442
-13.86%
jan 1, 1999
13.852
-1.322
-8.71%
jan 1, 2000
13.849
-0.003
-0.02%
jan 1, 2001
13.066
-0.783
-5.66%
jan 1, 2002
12.632
-0.434
-3.32%
jan 1, 2003
10.806
-1.826
-14.46%
jan 1, 2004
10.023
-0.783
-7.25%
jan 1, 2005
9.524
-0.499
-4.98%
jan 1, 2006
9.455
-0.069
-0.72%
jan 1, 2007
9.877
+0.422
4.47%
jan 1, 2008
9.675
-0.203
-2.05%
jan 1, 2009
9.43
-0.245
-2.53%
jan 1, 2010
10.415
+0.985
10.45%
jan 1, 2011
10.571
+0.156
1.5%
jan 1, 2012
8.842
-1.729
-16.36%
jan 1, 2013
7.167
-1.675
-18.94%
Ranking of countries by current statistics by years