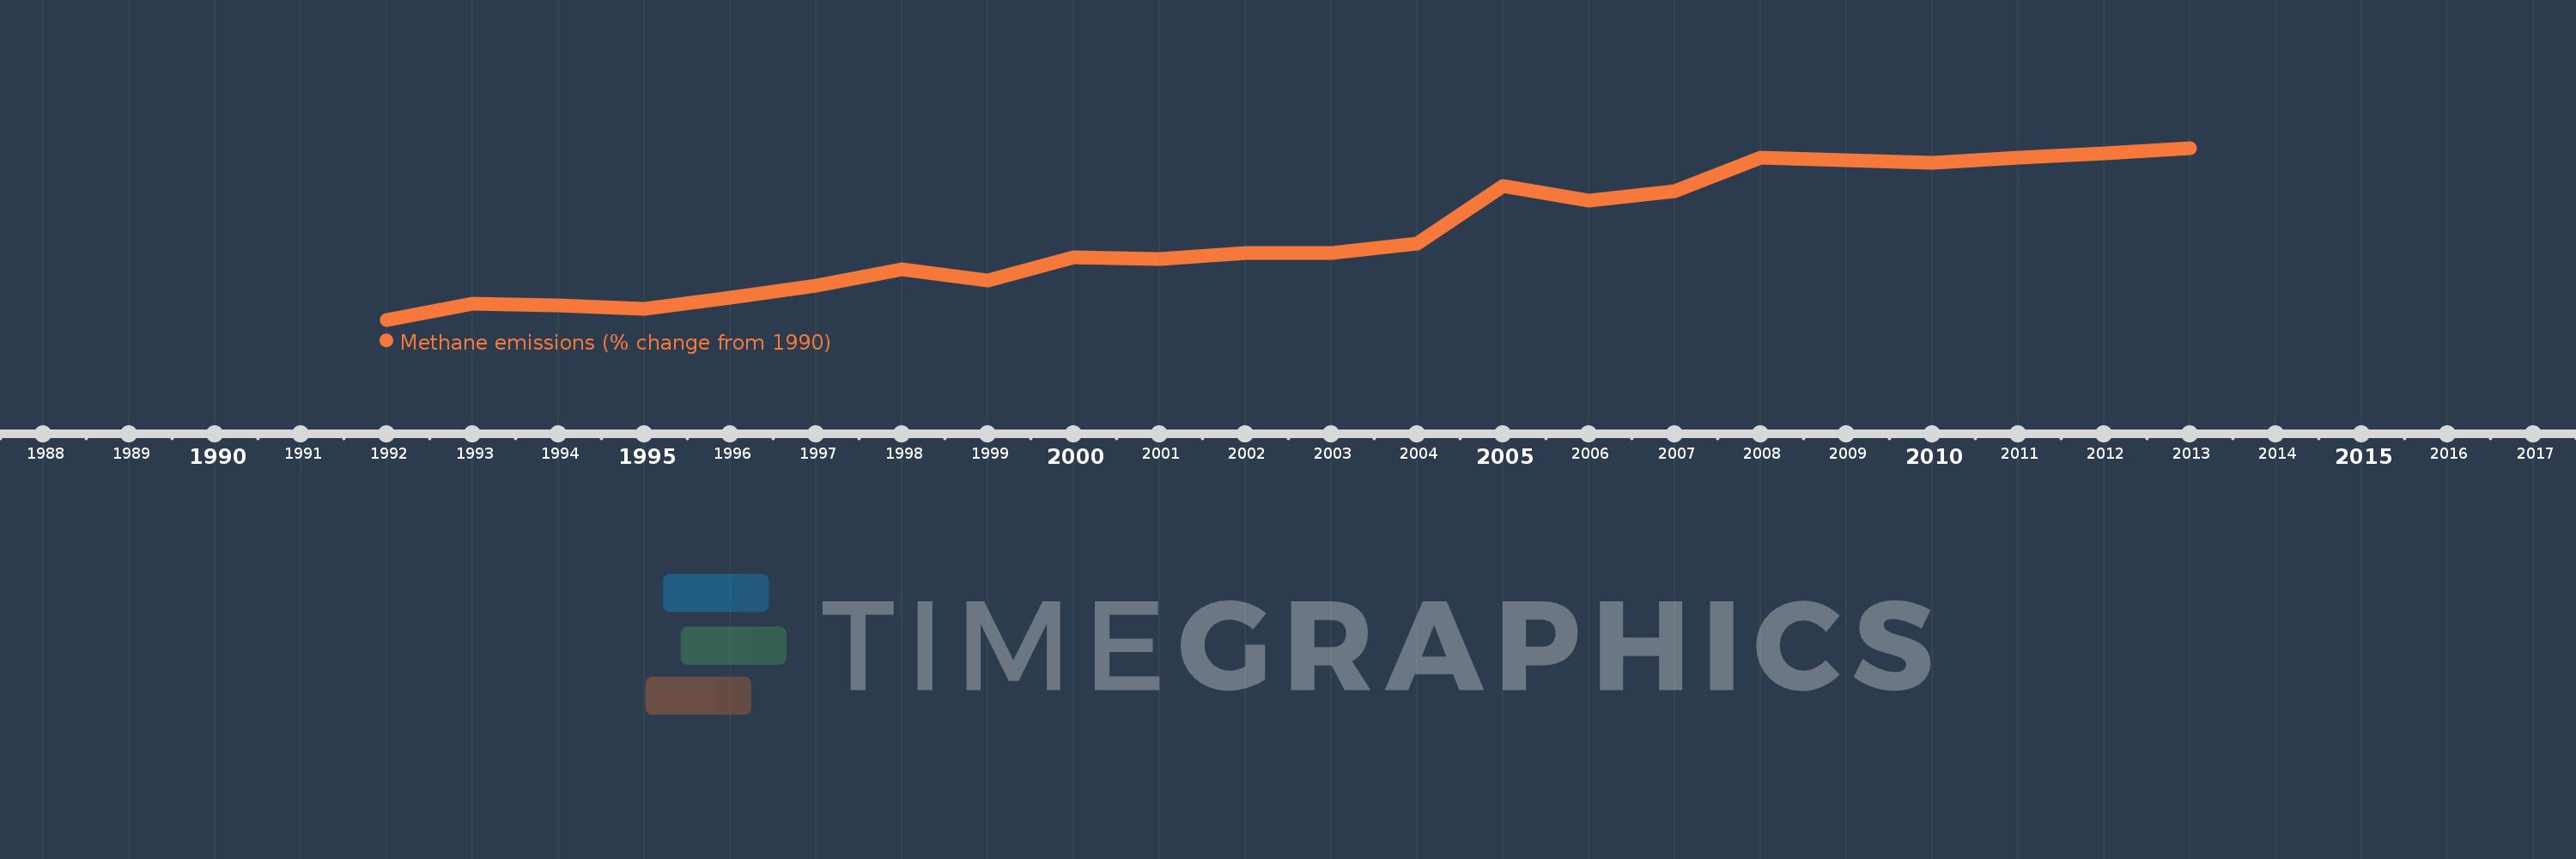
This timeline shows a graph from 1992 to 2013 of IDA blend. No data until 1991. Number of actual observations by date: 22.
Source name:
World Development Indicators
Source organization:
World Bank staff estimates from original source: European Commission, Joint Research Centre (JRC)/Netherlands Environmental Assessment Agency (PBL). Emission Database for Global Atmospheric Research (EDGAR): http://edgar.jrc.ec.europa.eu/.
Categories, topics:
Climate Change, Environment
Last updated:
apr 23, 2017
Indicators value changes by year
Meaning:
24.369
Minimum:
1.078
jan 1, 1992
Maximum:
47.888
jan 1, 2013
At the date of observation
Value
Absolute change
Change from the previous value
jan 1, 1992
1.078
+1.078
0.0%
jan 1, 1993
5.356
+4.278
396.99%
jan 1, 1994
4.978
-0.378
-7.06%
jan 1, 1995
4.078
-0.899
-18.07%
jan 1, 1996
7.116
+3.038
74.49%
jan 1, 1997
10.379
+3.262
45.84%
jan 1, 1998
14.85
+4.472
43.08%
jan 1, 1999
11.872
-2.978
-20.05%
jan 1, 2000
18.161
+6.289
52.97%
jan 1, 2001
17.595
-0.566
-3.12%
jan 1, 2002
19.194
+1.599
9.09%
jan 1, 2003
19.225
+0.03
0.16%
jan 1, 2004
21.89
+2.665
13.86%
jan 1, 2005
37.527
+15.637
71.44%
jan 1, 2006
33.578
-3.949
-10.52%
jan 1, 2007
36.064
+2.486
7.4%
jan 1, 2008
45.284
+9.22
25.57%
jan 1, 2009
44.578
-0.706
-1.56%
jan 1, 2010
43.788
-0.79
-1.77%
jan 1, 2011
45.134
+1.346
3.07%
jan 1, 2012
46.511
+1.377
3.05%
jan 1, 2013
47.888
+1.377
2.96%
Ranking of countries by current statistics by years