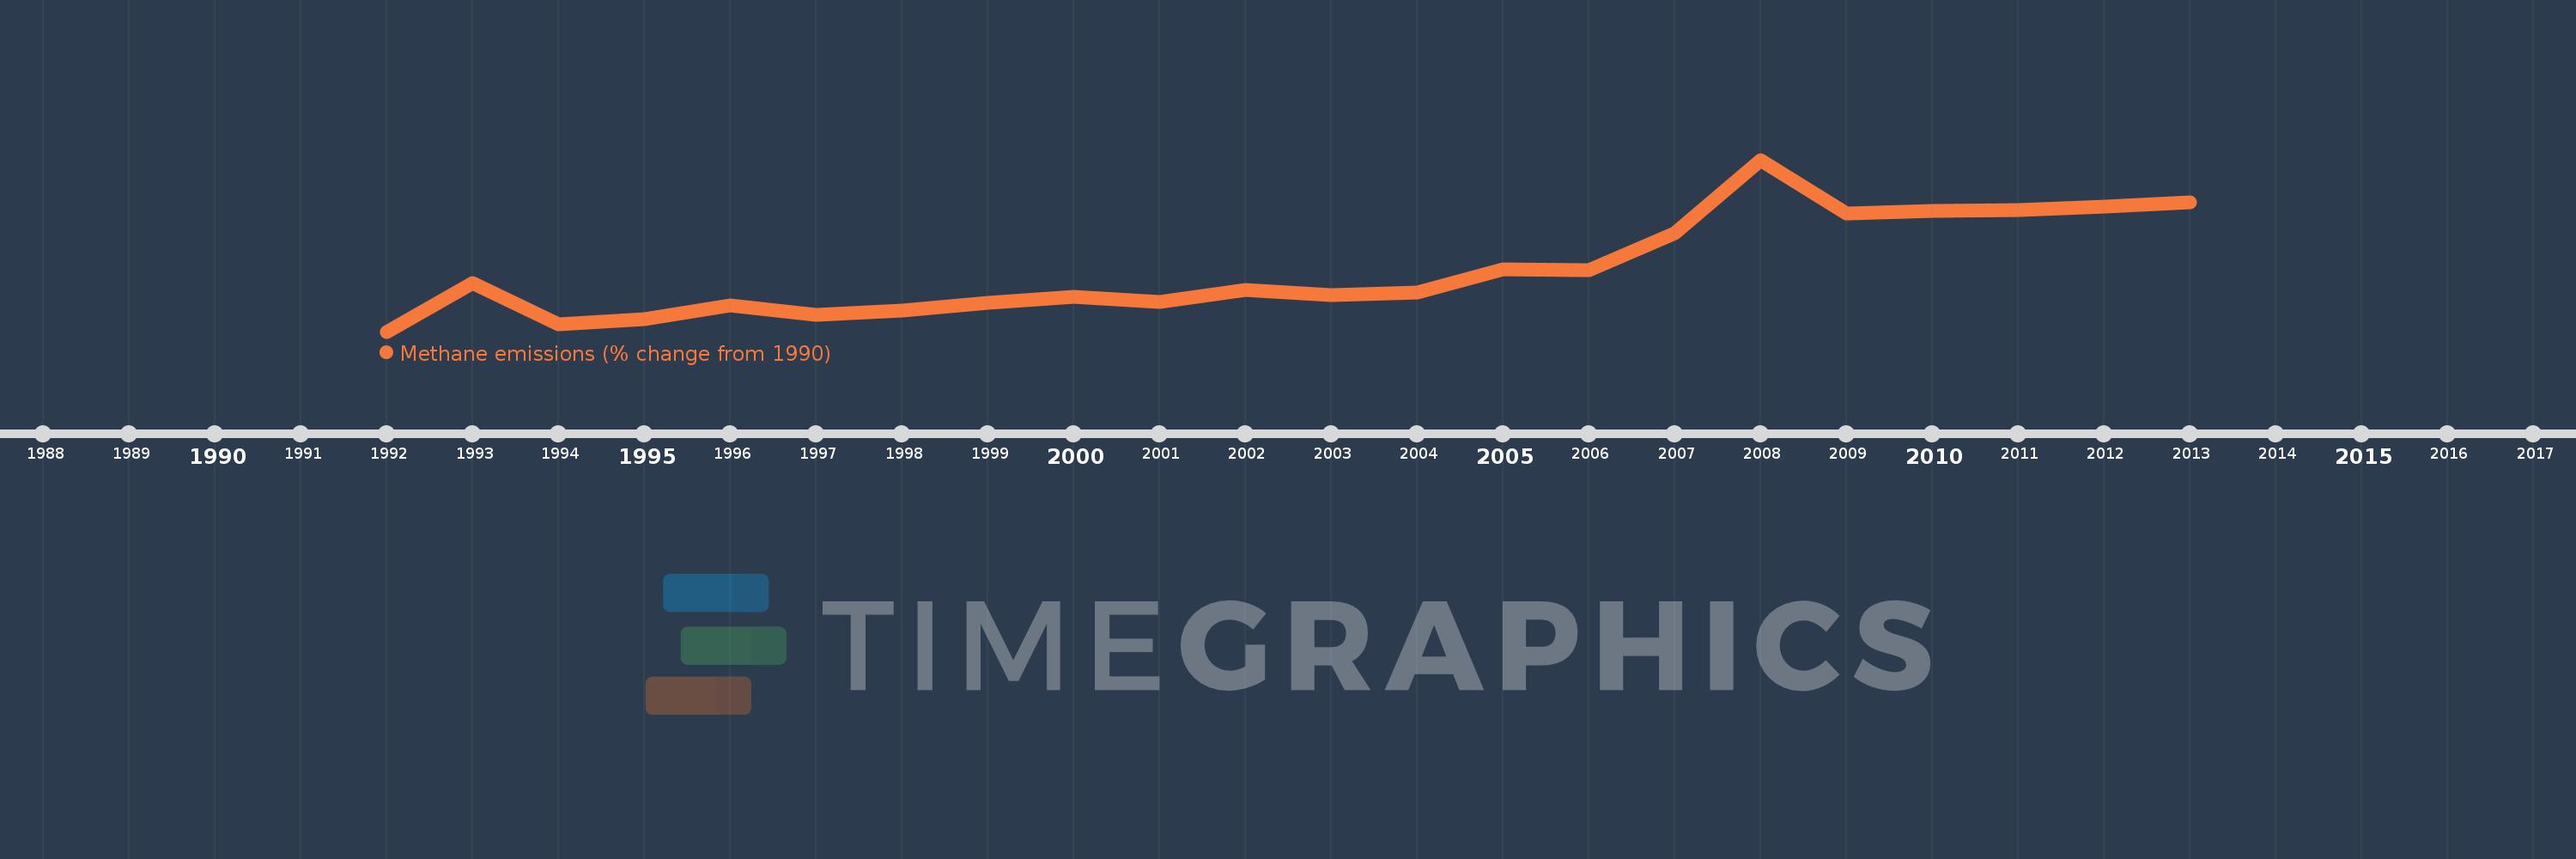
This timeline shows a graph from 1992 to 2013 of IDA total. No data until 1991. Number of actual observations by date: 22.
Source name:
World Development Indicators
Source organization:
World Bank staff estimates from original source: European Commission, Joint Research Centre (JRC)/Netherlands Environmental Assessment Agency (PBL). Emission Database for Global Atmospheric Research (EDGAR): http://edgar.jrc.ec.europa.eu/.
Categories, topics:
Climate Change, Environment
Last updated:
apr 23, 2017
Indicators value changes by year
Meaning:
14.261
Minimum:
-7.588
jan 1, 1992
Maximum:
53.455
jan 1, 2008
At the date of observation
Value
Absolute change
Change from the previous value
jan 1, 1992
-7.588
-7.588
0.0%
jan 1, 1993
9.585
+17.173
-226.31%
jan 1, 1994
-5.048
-14.633
-152.66%
jan 1, 1995
-3.043
+2.004
-39.71%
jan 1, 1996
1.744
+4.787
-157.31%
jan 1, 1997
-1.676
-3.421
-196.12%
jan 1, 1998
-0.028
+1.648
-98.32%
jan 1, 1999
2.511
+2.539
-9.02K%
jan 1, 2000
4.783
+2.272
90.51%
jan 1, 2001
2.98
-1.803
-37.7%
jan 1, 2002
7.293
+4.313
144.75%
jan 1, 2003
5.479
-1.814
-24.88%
jan 1, 2004
6.266
+0.787
14.37%
jan 1, 2005
14.666
+8.4
134.06%
jan 1, 2006
14.337
-0.33
-2.25%
jan 1, 2007
27.328
+12.992
90.62%
jan 1, 2008
53.455
+26.126
95.6%
jan 1, 2009
34.443
-19.012
-35.57%
jan 1, 2010
35.38
+0.938
2.72%
jan 1, 2011
35.598
+0.218
0.62%
jan 1, 2012
36.96
+1.362
3.82%
jan 1, 2013
38.322
+1.362
3.68%
Ranking of countries by current statistics by years