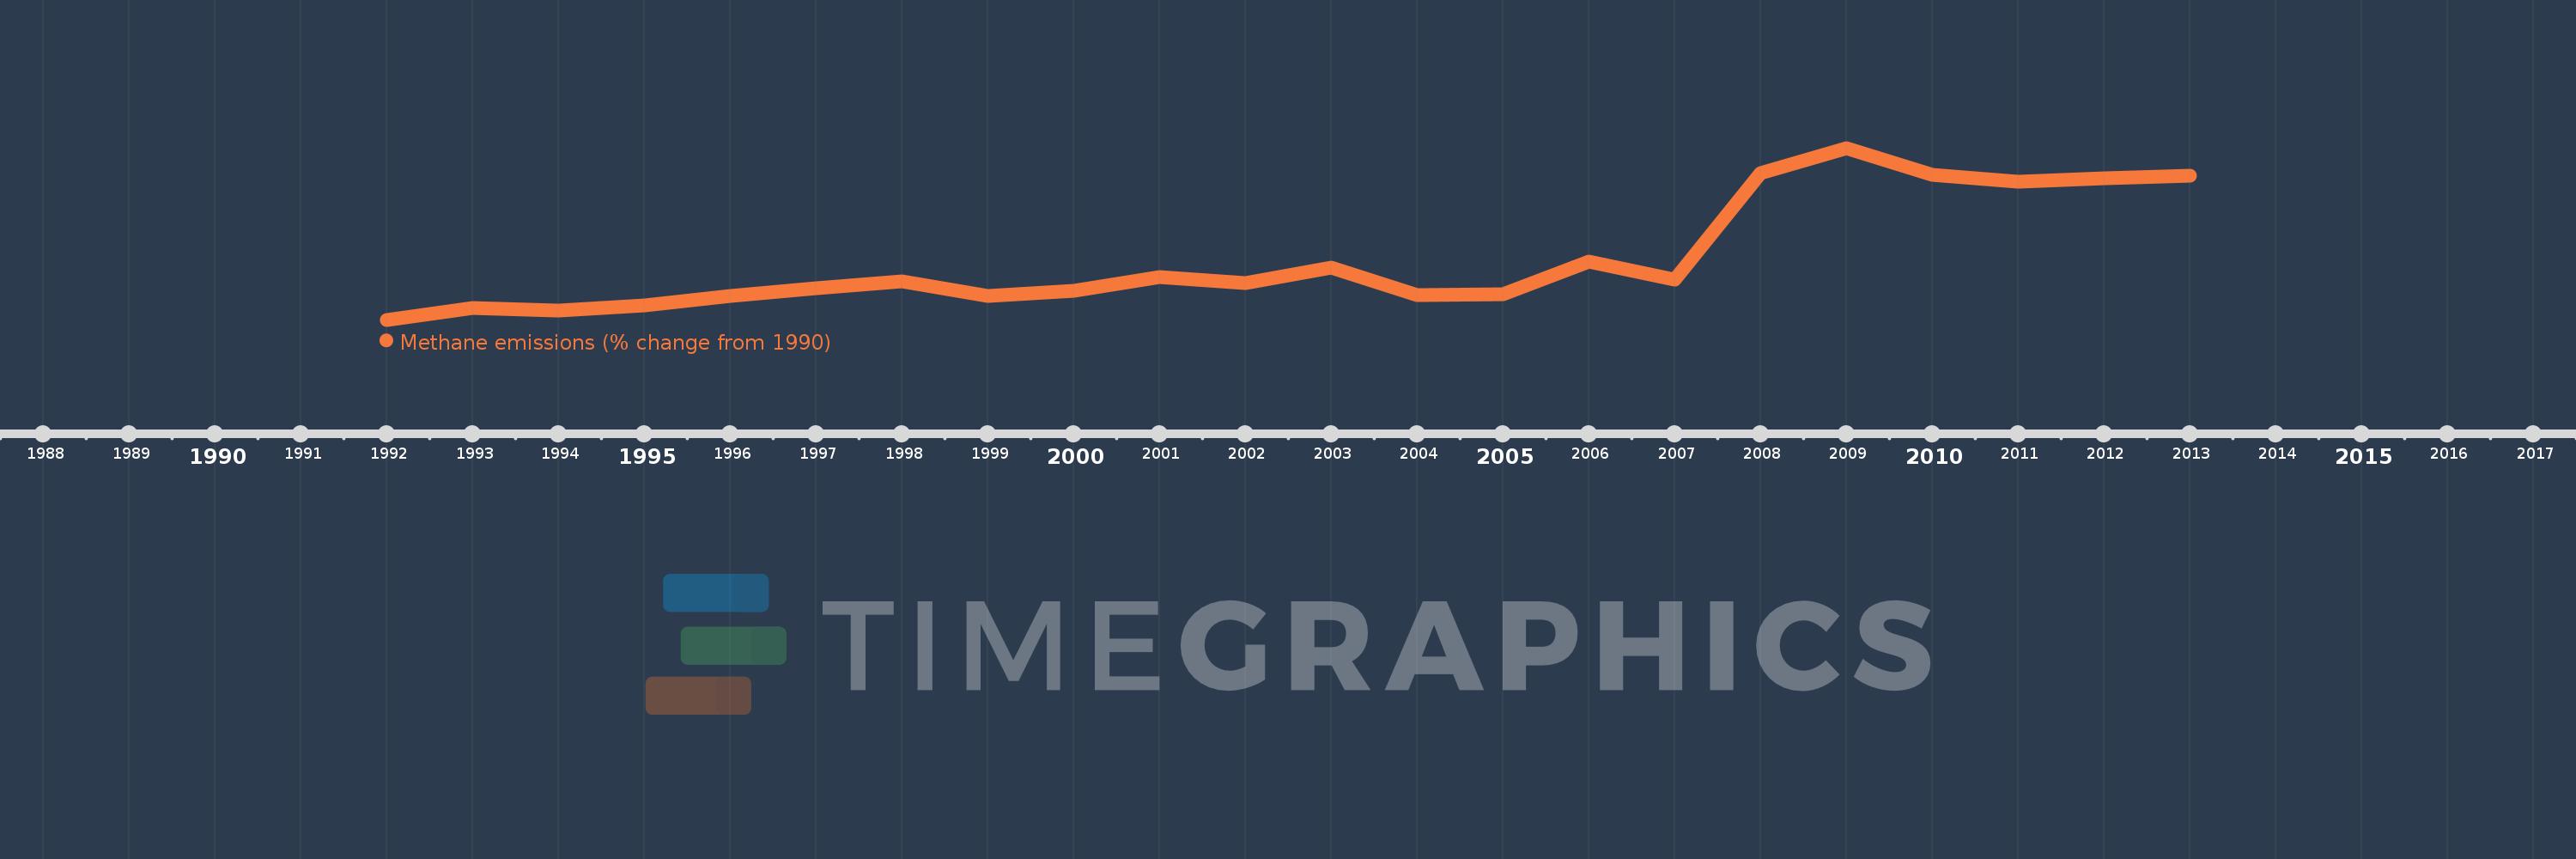
This timeline shows a graph from 1992 to 2013 of Togo. No data until 1991. Number of actual observations by date: 22.
Source name:
World Development Indicators
Source organization:
World Bank staff estimates from original source: European Commission, Joint Research Centre (JRC)/Netherlands Environmental Assessment Agency (PBL). Emission Database for Global Atmospheric Research (EDGAR): http://edgar.jrc.ec.europa.eu/.
Categories, topics:
Climate Change, Environment
Last updated:
apr 23, 2017
Indicators value changes by year
Meaning:
22.68
Minimum:
-14.608
jan 1, 1992
Maximum:
89.872
jan 1, 2009
At the date of observation
Value
Absolute change
Change from the previous value
jan 1, 1992
-14.608
-14.608
0.0%
jan 1, 1993
-7.563
+7.044
-48.22%
jan 1, 1994
-8.911
-1.347
17.82%
jan 1, 1995
-5.778
+3.133
-35.16%
jan 1, 1996
-0.261
+5.517
-95.48%
jan 1, 1997
4.724
+4.985
-1.91K%
jan 1, 1998
8.579
+3.855
81.6%
jan 1, 1999
-0.151
-8.731
-101.77%
jan 1, 2000
3.206
+3.358
-2.22K%
jan 1, 2001
11.332
+8.126
253.46%
jan 1, 2002
7.51
-3.822
-33.72%
jan 1, 2003
17.338
+9.828
130.85%
jan 1, 2004
0.212
-17.126
-98.78%
jan 1, 2005
0.833
+0.621
293.58%
jan 1, 2006
20.792
+19.959
2.4K%
jan 1, 2007
9.785
-11.007
-52.94%
jan 1, 2008
74.696
+64.911
663.38%
jan 1, 2009
89.872
+15.177
20.32%
jan 1, 2010
73.652
-16.22
-18.05%
jan 1, 2011
69.541
-4.111
-5.58%
jan 1, 2012
71.237
+1.695
2.44%
jan 1, 2013
72.932
+1.695
2.38%
Ranking of countries by current statistics by years