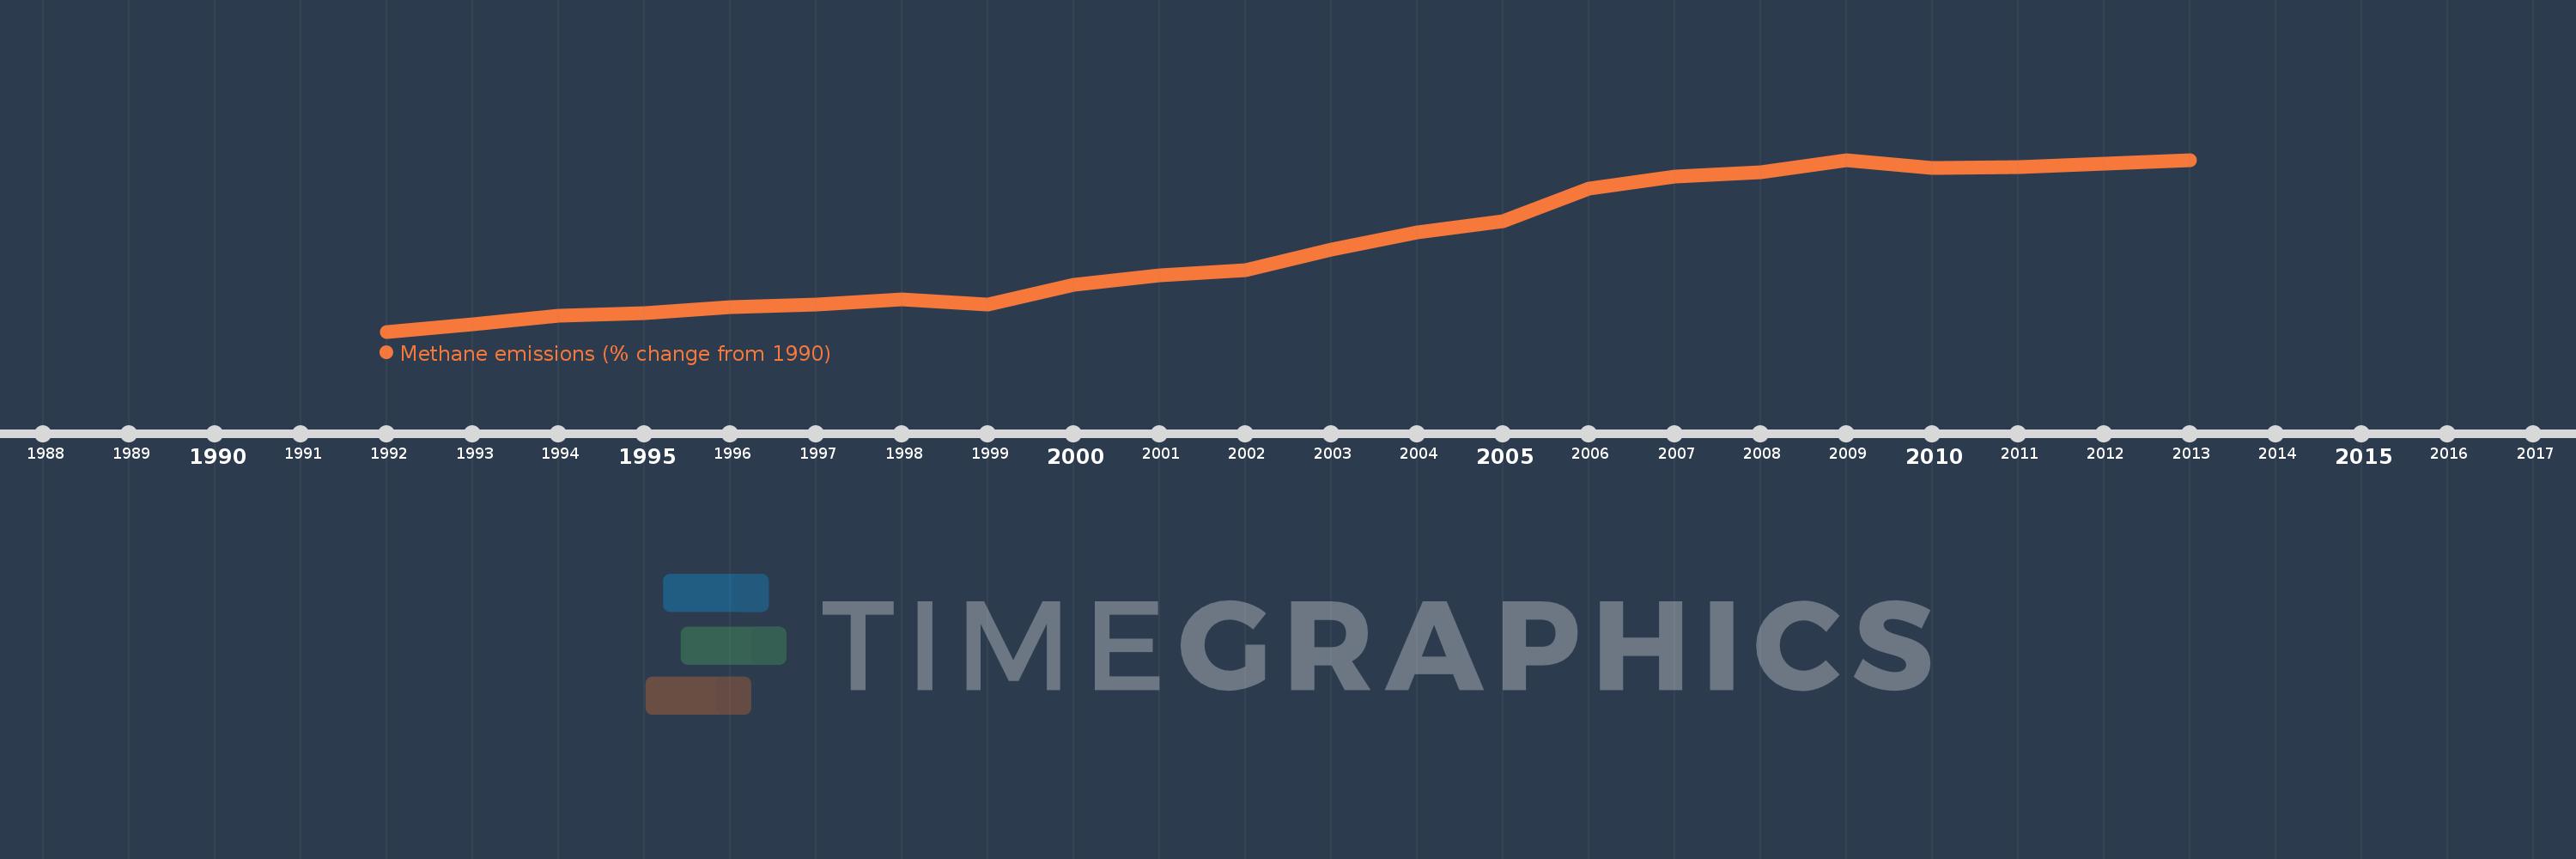
This timeline shows a graph from 1992 to 2013 of Egypt, Arab Rep.. No data until 1991. Number of actual observations by date: 22.
Source name:
World Development Indicators
Source organization:
World Bank staff estimates from original source: European Commission, Joint Research Centre (JRC)/Netherlands Environmental Assessment Agency (PBL). Emission Database for Global Atmospheric Research (EDGAR): http://edgar.jrc.ec.europa.eu/.
Categories, topics:
Climate Change, Environment
Last updated:
apr 23, 2017
Indicators value changes by year
Meaning:
48.845
Minimum:
4.3
jan 1, 1992
Maximum:
92.651
jan 1, 2009
At the date of observation
Value
Absolute change
Change from the previous value
jan 1, 1992
4.3
+4.3
0.0%
jan 1, 1993
8.063
+3.764
87.52%
jan 1, 1994
12.422
+4.358
54.05%
jan 1, 1995
13.85
+1.428
11.5%
jan 1, 1996
16.725
+2.876
20.76%
jan 1, 1997
17.997
+1.271
7.6%
jan 1, 1998
21.0
+3.003
16.69%
jan 1, 1999
18.303
-2.697
-12.84%
jan 1, 2000
28.361
+10.058
54.95%
jan 1, 2001
33.205
+4.844
17.08%
jan 1, 2002
35.993
+2.788
8.4%
jan 1, 2003
46.548
+10.556
29.33%
jan 1, 2004
55.423
+8.875
19.07%
jan 1, 2005
61.191
+5.768
10.41%
jan 1, 2006
77.67
+16.479
26.93%
jan 1, 2007
84.25
+6.579
8.47%
jan 1, 2008
86.091
+1.841
2.18%
jan 1, 2009
92.651
+6.56
7.62%
jan 1, 2010
88.548
-4.103
-4.43%
jan 1, 2011
88.778
+0.23
0.26%
jan 1, 2012
90.666
+1.888
2.13%
jan 1, 2013
92.554
+1.888
2.08%
Ranking of countries by current statistics by years