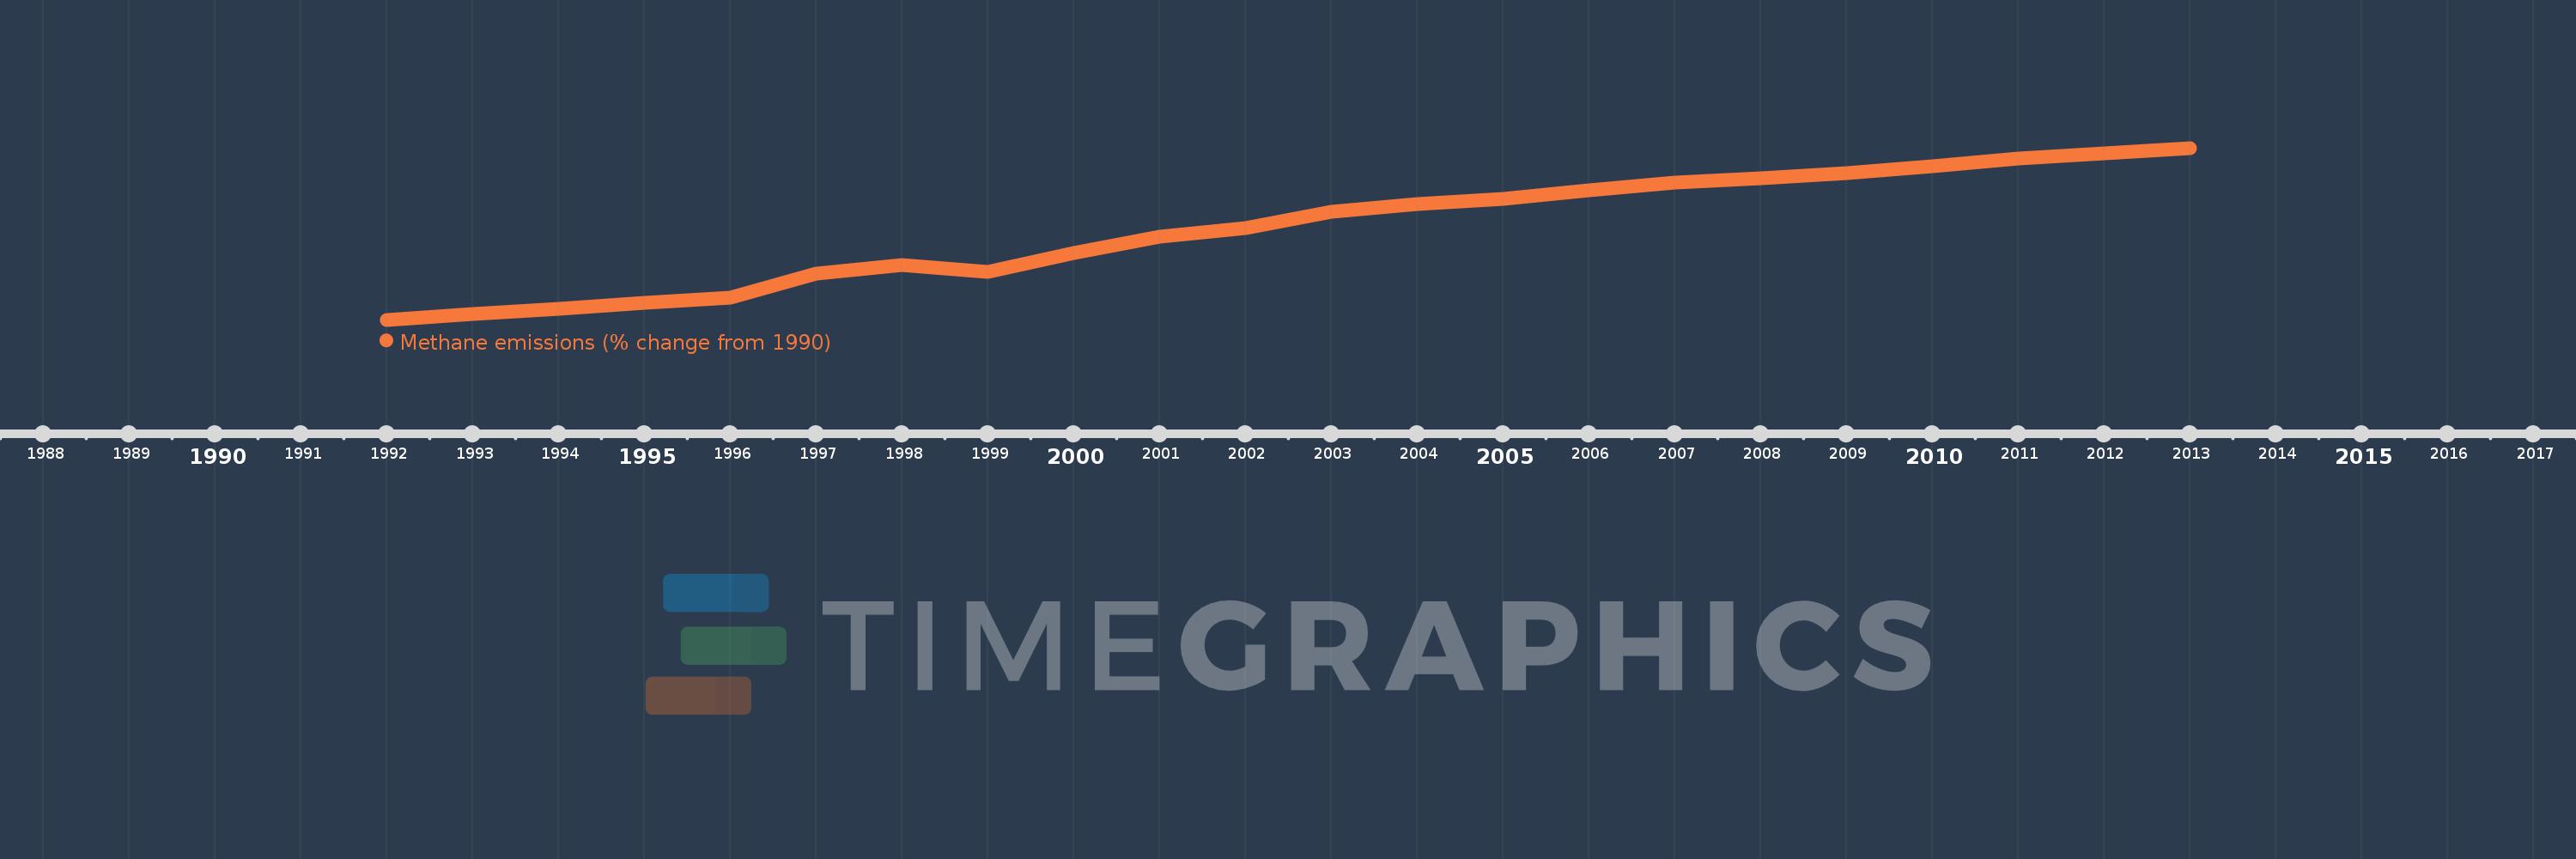
This timeline shows a graph from 1992 to 2013 of Grenada. No data until 1991. Number of actual observations by date: 22.
Source name:
World Development Indicators
Source organization:
World Bank staff estimates from original source: European Commission, Joint Research Centre (JRC)/Netherlands Environmental Assessment Agency (PBL). Emission Database for Global Atmospheric Research (EDGAR): http://edgar.jrc.ec.europa.eu/.
Categories, topics:
Climate Change, Environment
Last updated:
apr 23, 2017
Indicators value changes by year
Meaning:
26.177
Minimum:
1.498
jan 1, 1992
Maximum:
48.187
jan 1, 2013
At the date of observation
Value
Absolute change
Change from the previous value
jan 1, 1992
1.498
+1.498
0.0%
jan 1, 1993
3.099
+1.601
106.91%
jan 1, 1994
4.431
+1.332
42.97%
jan 1, 1995
6.062
+1.631
36.82%
jan 1, 1996
7.388
+1.326
21.87%
jan 1, 1997
14.023
+6.635
89.81%
jan 1, 1998
16.294
+2.271
16.19%
jan 1, 1999
14.42
-1.874
-11.5%
jan 1, 2000
19.675
+5.255
36.44%
jan 1, 2001
24.008
+4.333
22.02%
jan 1, 2002
26.369
+2.361
9.83%
jan 1, 2003
30.9
+4.531
17.18%
jan 1, 2004
32.957
+2.058
6.66%
jan 1, 2005
34.334
+1.377
4.18%
jan 1, 2006
36.761
+2.427
7.07%
jan 1, 2007
38.847
+2.086
5.67%
jan 1, 2008
39.93
+1.083
2.79%
jan 1, 2009
41.39
+1.46
3.66%
jan 1, 2010
43.311
+1.921
4.64%
jan 1, 2011
45.281
+1.97
4.55%
jan 1, 2012
46.734
+1.453
3.21%
jan 1, 2013
48.187
+1.453
3.11%
Ranking of countries by current statistics by years