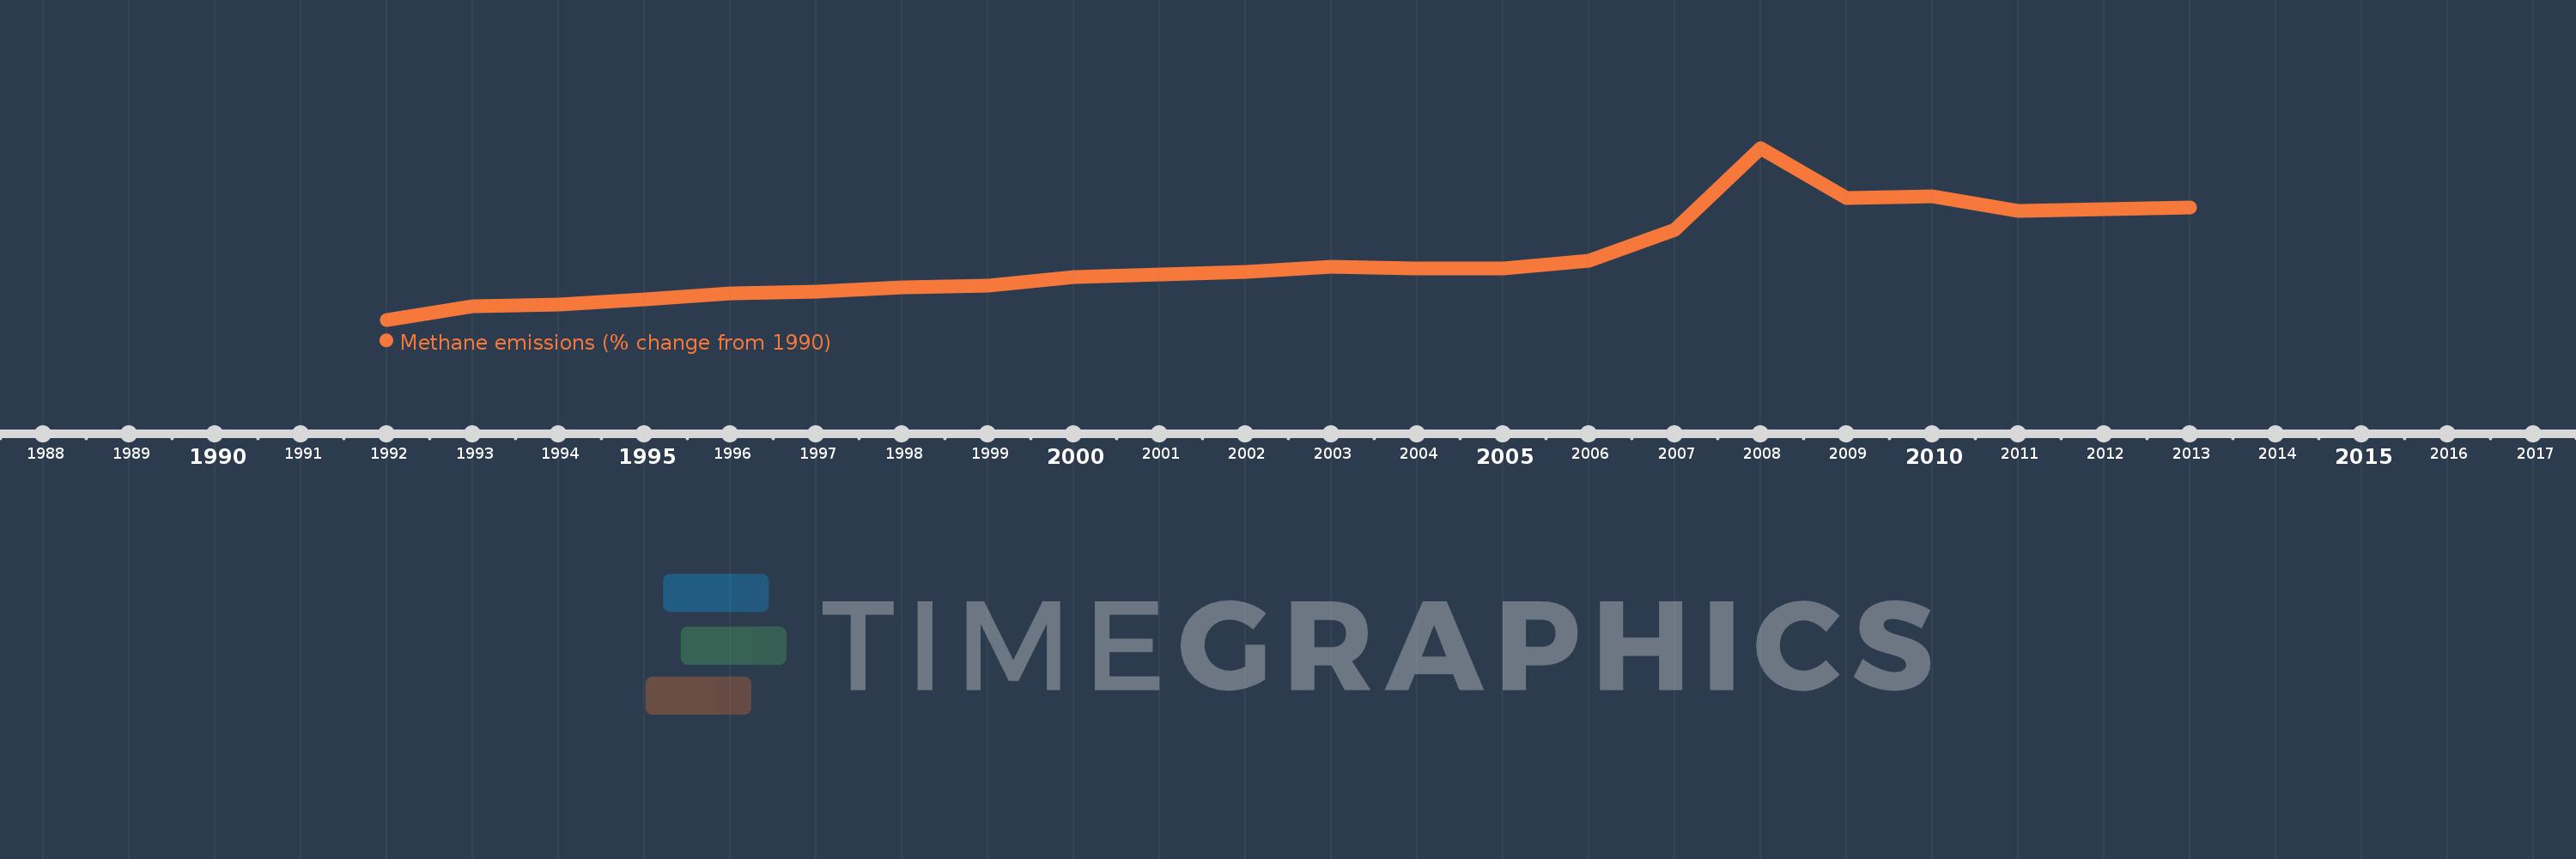
This timeline shows a graph from 1992 to 2013 of Sudan. No data until 1991. Number of actual observations by date: 22.
Source name:
World Development Indicators
Source organization:
World Bank staff estimates from original source: European Commission, Joint Research Centre (JRC)/Netherlands Environmental Assessment Agency (PBL). Emission Database for Global Atmospheric Research (EDGAR): http://edgar.jrc.ec.europa.eu/.
Categories, topics:
Climate Change, Environment
Last updated:
apr 23, 2017
Indicators value changes by year
Meaning:
53.039
Minimum:
-9.829
jan 1, 1992
Maximum:
165.256
jan 1, 2008
At the date of observation
Value
Absolute change
Change from the previous value
jan 1, 1992
-9.829
-9.829
0.0%
jan 1, 1993
3.684
+13.514
-137.48%
jan 1, 1994
5.257
+1.572
42.68%
jan 1, 1995
10.614
+5.357
101.91%
jan 1, 1996
16.955
+6.341
59.75%
jan 1, 1997
18.808
+1.853
10.93%
jan 1, 1998
22.919
+4.111
21.86%
jan 1, 1999
24.496
+1.577
6.88%
jan 1, 2000
33.879
+9.383
38.31%
jan 1, 2001
36.624
+2.745
8.1%
jan 1, 2002
39.202
+2.578
7.04%
jan 1, 2003
43.816
+4.614
11.77%
jan 1, 2004
42.122
-1.695
-3.87%
jan 1, 2005
42.738
+0.617
1.46%
jan 1, 2006
49.891
+7.153
16.74%
jan 1, 2007
81.89
+31.999
64.14%
jan 1, 2008
165.256
+83.366
101.8%
jan 1, 2009
114.233
-51.023
-30.88%
jan 1, 2010
116.021
+1.788
1.57%
jan 1, 2011
100.755
-15.265
-13.16%
jan 1, 2012
102.763
+2.008
1.99%
jan 1, 2013
104.77
+2.008
1.95%
Ranking of countries by current statistics by years