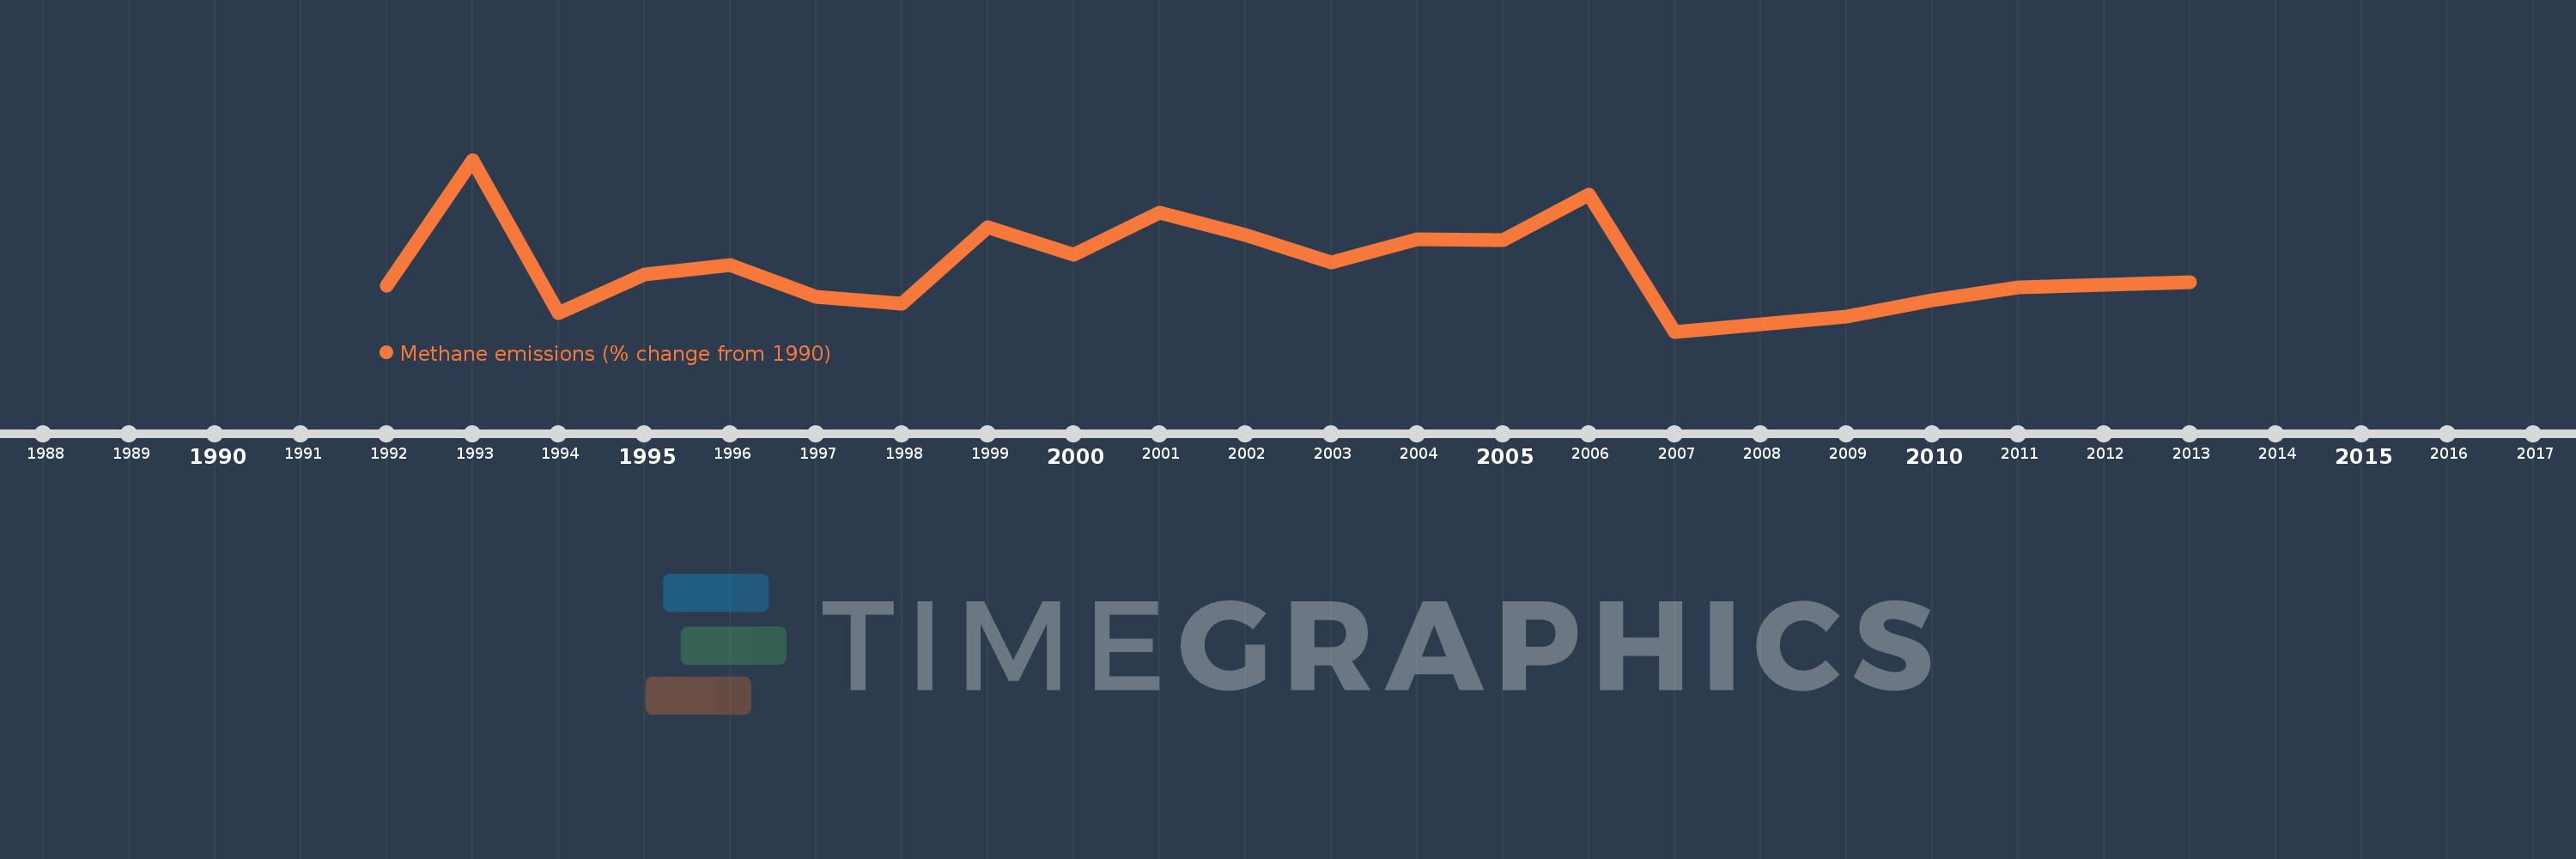
This timeline shows a graph from 1992 to 2013 of Mozambique. No data until 1991. Number of actual observations by date: 22.
Source name:
World Development Indicators
Source organization:
World Bank staff estimates from original source: European Commission, Joint Research Centre (JRC)/Netherlands Environmental Assessment Agency (PBL). Emission Database for Global Atmospheric Research (EDGAR): http://edgar.jrc.ec.europa.eu/.
Categories, topics:
Climate Change, Environment
Last updated:
apr 23, 2017
Indicators value changes by year
Meaning:
-10.043
Minimum:
-33.316
jan 1, 2007
Maximum:
29.453
jan 1, 1993
At the date of observation
Value
Absolute change
Change from the previous value
jan 1, 1992
-16.675
-16.675
0.0%
jan 1, 1993
29.453
+46.127
-276.63%
jan 1, 1994
-26.424
-55.877
-189.72%
jan 1, 1995
-12.512
+13.912
-52.65%
jan 1, 1996
-9.132
+3.38
-27.02%
jan 1, 1997
-20.748
-11.616
127.2%
jan 1, 1998
-23.238
-2.491
12.0%
jan 1, 1999
4.795
+28.034
-120.63%
jan 1, 2000
-5.27
-10.066
-209.91%
jan 1, 2001
10.079
+15.35
-291.24%
jan 1, 2002
1.959
-8.12
-80.57%
jan 1, 2003
-8.159
-10.117
-516.51%
jan 1, 2004
0.321
+8.479
-103.93%
jan 1, 2005
0.039
-0.282
-87.83%
jan 1, 2006
16.692
+16.653
42.66K%
jan 1, 2007
-33.316
-50.008
-299.59%
jan 1, 2008
-30.63
+2.686
-8.06%
jan 1, 2009
-27.712
+2.918
-9.53%
jan 1, 2010
-21.763
+5.949
-21.47%
jan 1, 2011
-17.062
+4.701
-21.6%
jan 1, 2012
-16.233
+0.829
-4.86%
jan 1, 2013
-15.403
+0.829
-5.11%
Ranking of countries by current statistics by years