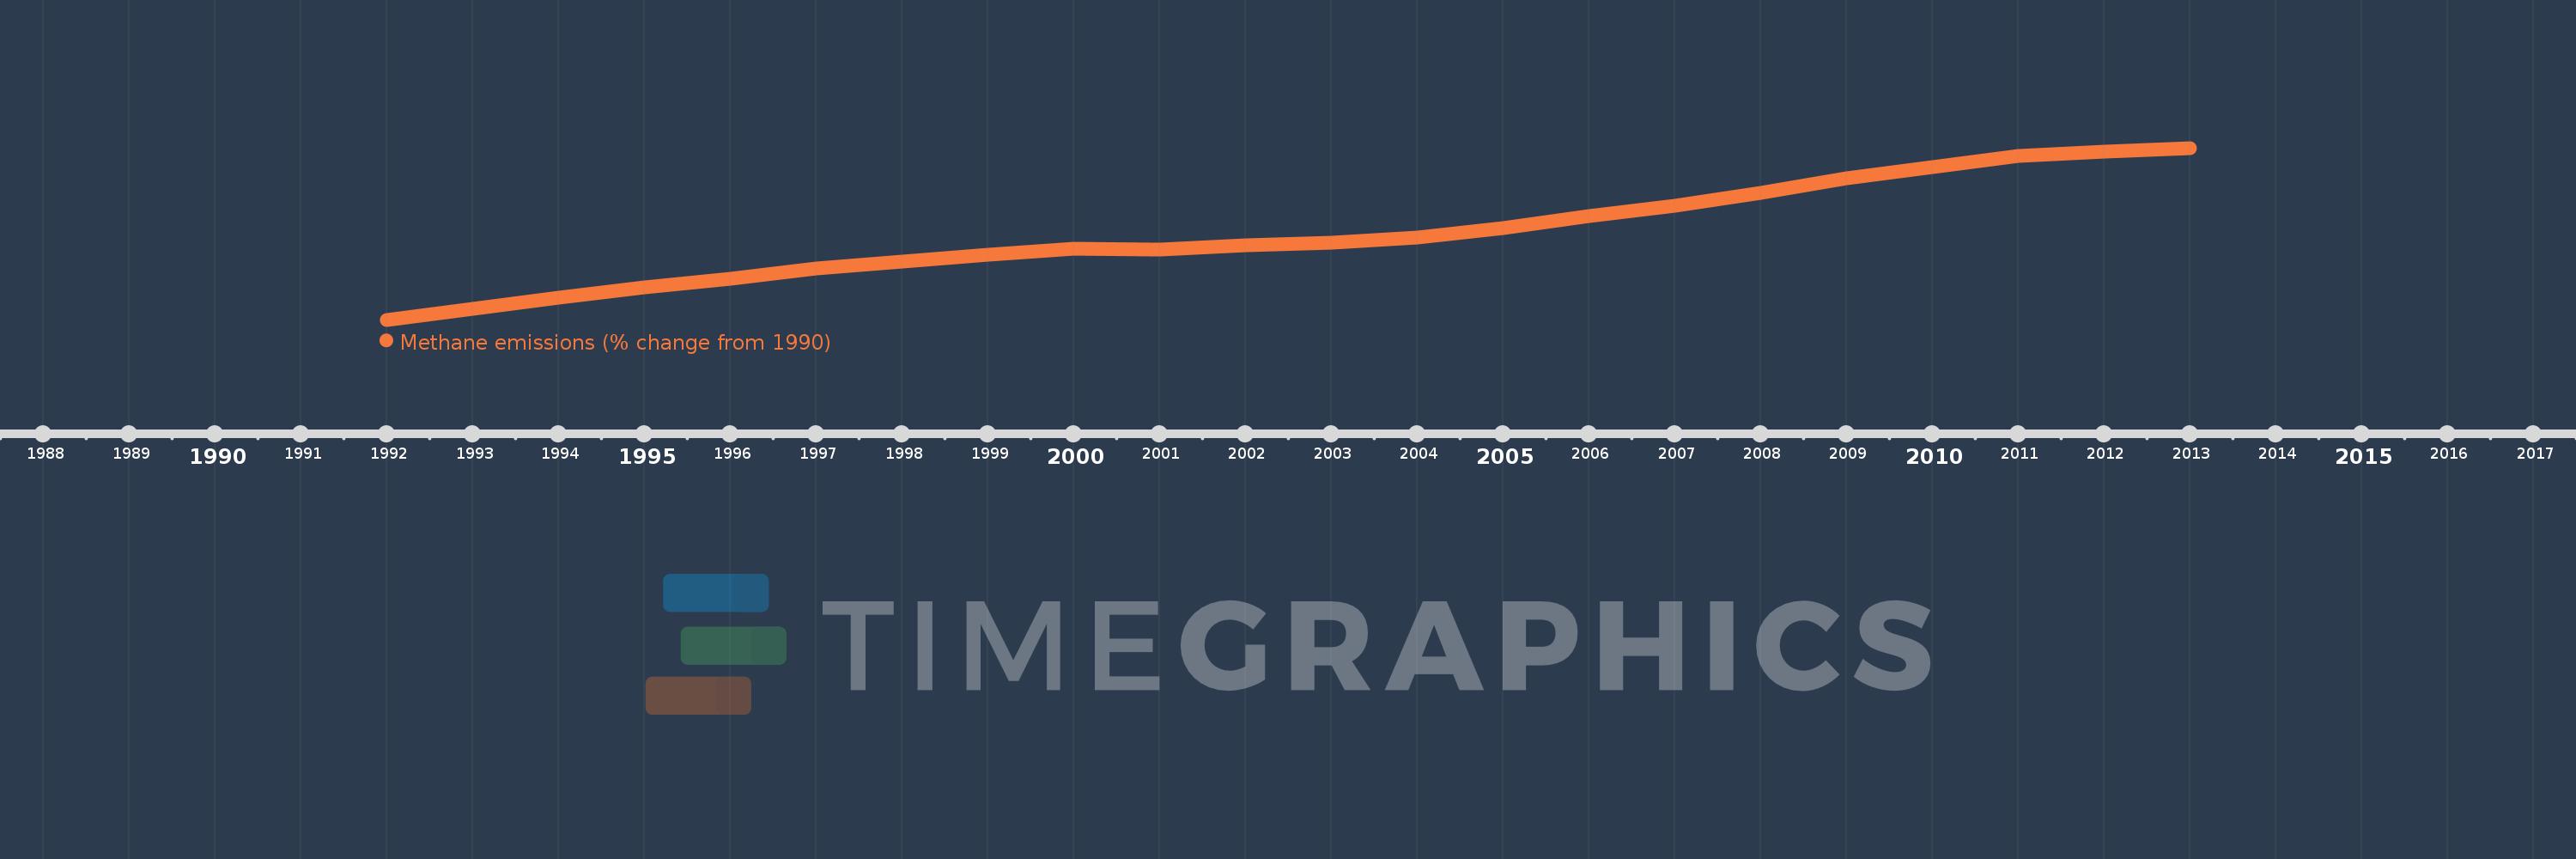
This timeline shows a graph from 1992 to 2013 of Macao SAR, China. No data until 1991. Number of actual observations by date: 22.
Source name:
World Development Indicators
Source organization:
World Bank staff estimates from original source: European Commission, Joint Research Centre (JRC)/Netherlands Environmental Assessment Agency (PBL). Emission Database for Global Atmospheric Research (EDGAR): http://edgar.jrc.ec.europa.eu/.
Categories, topics:
Climate Change, Environment
Last updated:
apr 23, 2017
Indicators value changes by year
Meaning:
40.986
Minimum:
4.756
jan 1, 1992
Maximum:
77.239
jan 1, 2013
At the date of observation
Value
Absolute change
Change from the previous value
jan 1, 1992
4.756
+4.756
0.0%
jan 1, 1993
9.454
+4.698
98.77%
jan 1, 1994
14.124
+4.67
49.39%
jan 1, 1995
18.431
+4.307
30.49%
jan 1, 1996
22.134
+3.703
20.09%
jan 1, 1997
26.269
+4.135
18.68%
jan 1, 1998
29.193
+2.924
11.13%
jan 1, 1999
32.141
+2.949
10.1%
jan 1, 2000
34.585
+2.444
7.6%
jan 1, 2001
34.448
-0.137
-0.39%
jan 1, 2002
36.186
+1.737
5.04%
jan 1, 2003
37.354
+1.169
3.23%
jan 1, 2004
39.421
+2.067
5.53%
jan 1, 2005
43.276
+3.855
9.78%
jan 1, 2006
48.616
+5.339
12.34%
jan 1, 2007
52.733
+4.117
8.47%
jan 1, 2008
58.458
+5.725
10.86%
jan 1, 2009
64.579
+6.121
10.47%
jan 1, 2010
69.04
+4.461
6.91%
jan 1, 2011
73.764
+4.724
6.84%
jan 1, 2012
75.502
+1.738
2.36%
jan 1, 2013
77.239
+1.738
2.3%
Ranking of countries by current statistics by years