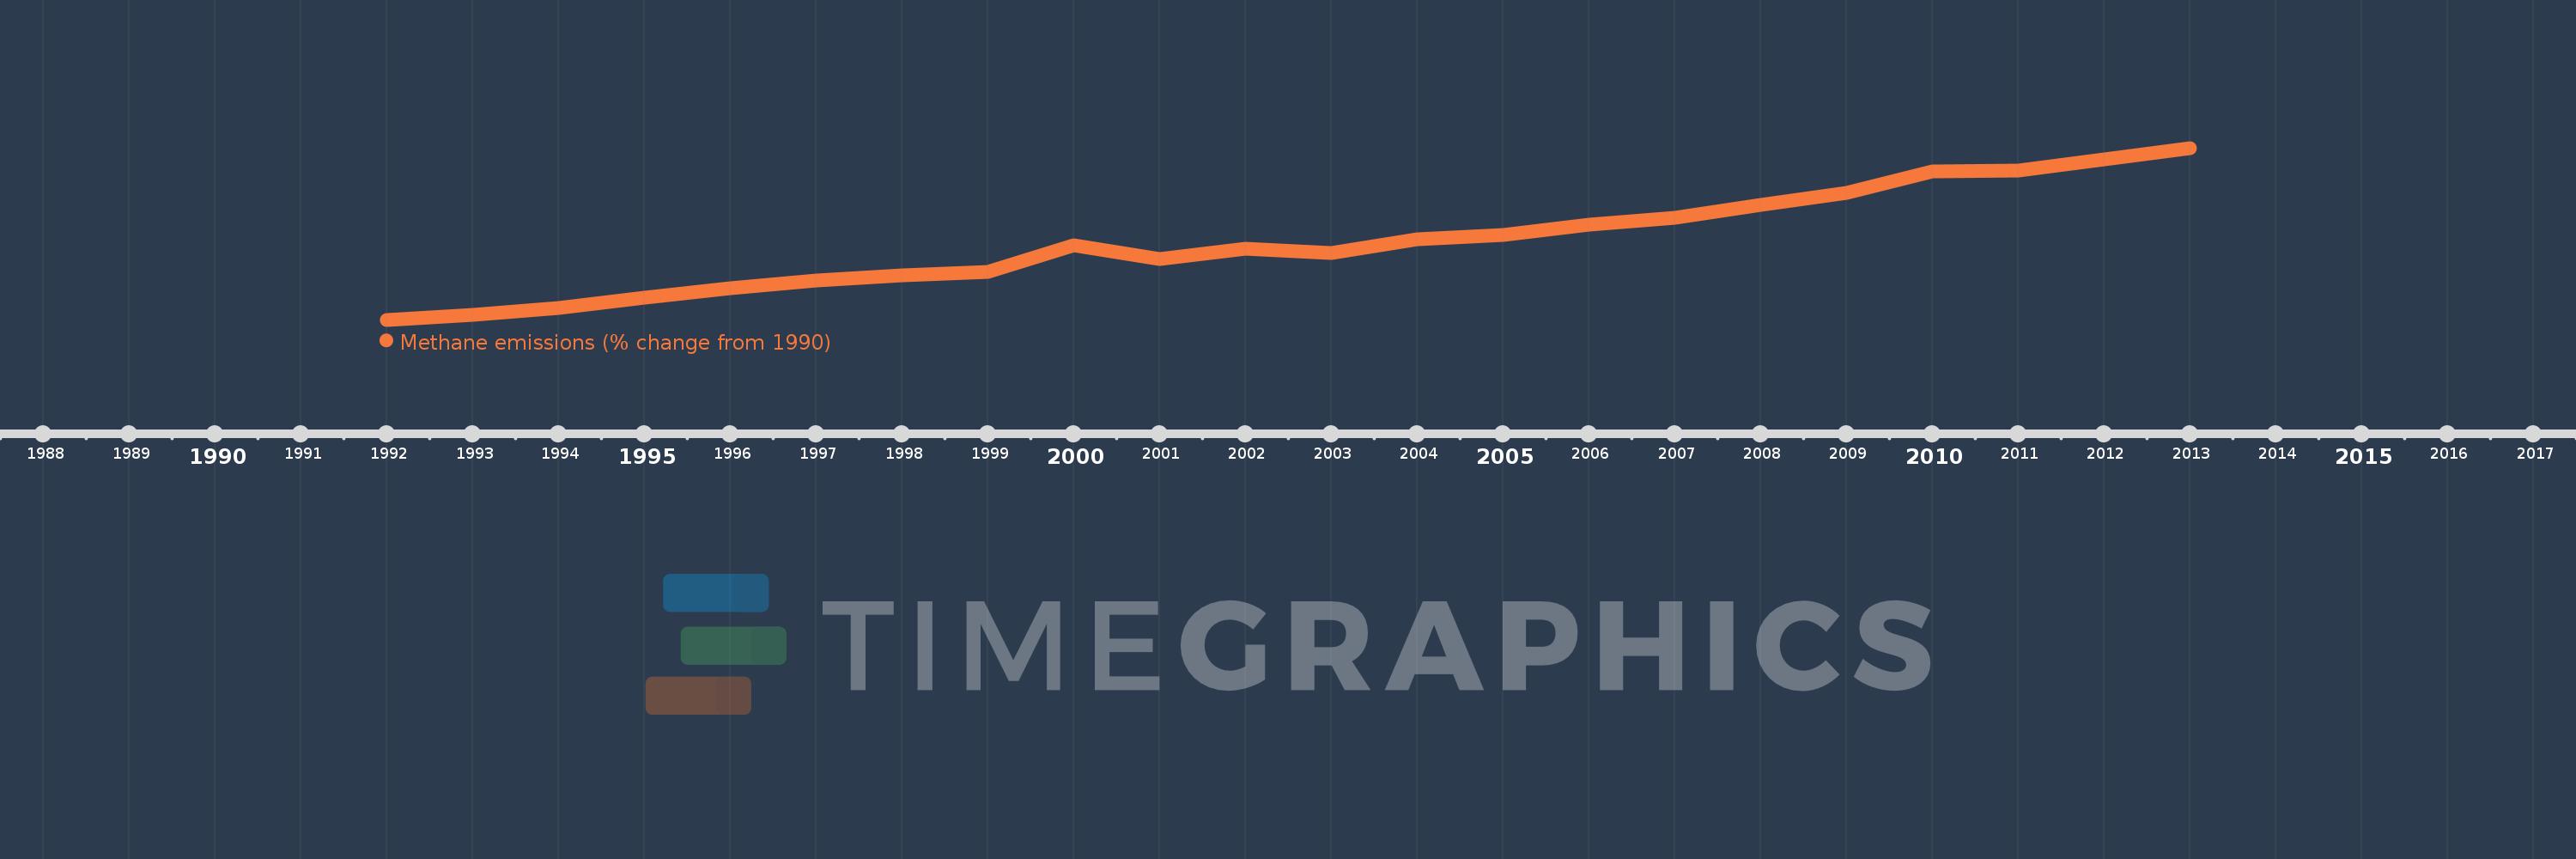
This timeline shows a graph from 1992 to 2013 of India. No data until 1991. Number of actual observations by date: 22.
Source name:
World Development Indicators
Source organization:
World Bank staff estimates from original source: European Commission, Joint Research Centre (JRC)/Netherlands Environmental Assessment Agency (PBL). Emission Database for Global Atmospheric Research (EDGAR): http://edgar.jrc.ec.europa.eu/.
Categories, topics:
Climate Change, Environment
Last updated:
apr 23, 2017
Indicators value changes by year
Meaning:
11.59
Minimum:
1.412
jan 1, 1992
Maximum:
23.884
jan 1, 2013
At the date of observation
Value
Absolute change
Change from the previous value
jan 1, 1992
1.412
+1.412
0.0%
jan 1, 1993
2.106
+0.693
49.1%
jan 1, 1994
3.0
+0.895
42.49%
jan 1, 1995
4.307
+1.306
43.54%
jan 1, 1996
5.561
+1.254
29.12%
jan 1, 1997
6.594
+1.034
18.59%
jan 1, 1998
7.248
+0.654
9.92%
jan 1, 1999
7.696
+0.448
6.18%
jan 1, 2000
11.186
+3.489
45.34%
jan 1, 2001
9.35
-1.836
-16.41%
jan 1, 2002
10.662
+1.313
14.04%
jan 1, 2003
10.168
-0.494
-4.63%
jan 1, 2004
11.988
+1.82
17.9%
jan 1, 2005
12.461
+0.473
3.94%
jan 1, 2006
13.816
+1.355
10.87%
jan 1, 2007
14.795
+0.979
7.09%
jan 1, 2008
16.423
+1.628
11.01%
jan 1, 2009
18.038
+1.615
9.83%
jan 1, 2010
20.871
+2.833
15.71%
jan 1, 2011
20.98
+0.109
0.52%
jan 1, 2012
22.432
+1.452
6.92%
jan 1, 2013
23.884
+1.452
6.47%
Ranking of countries by current statistics by years