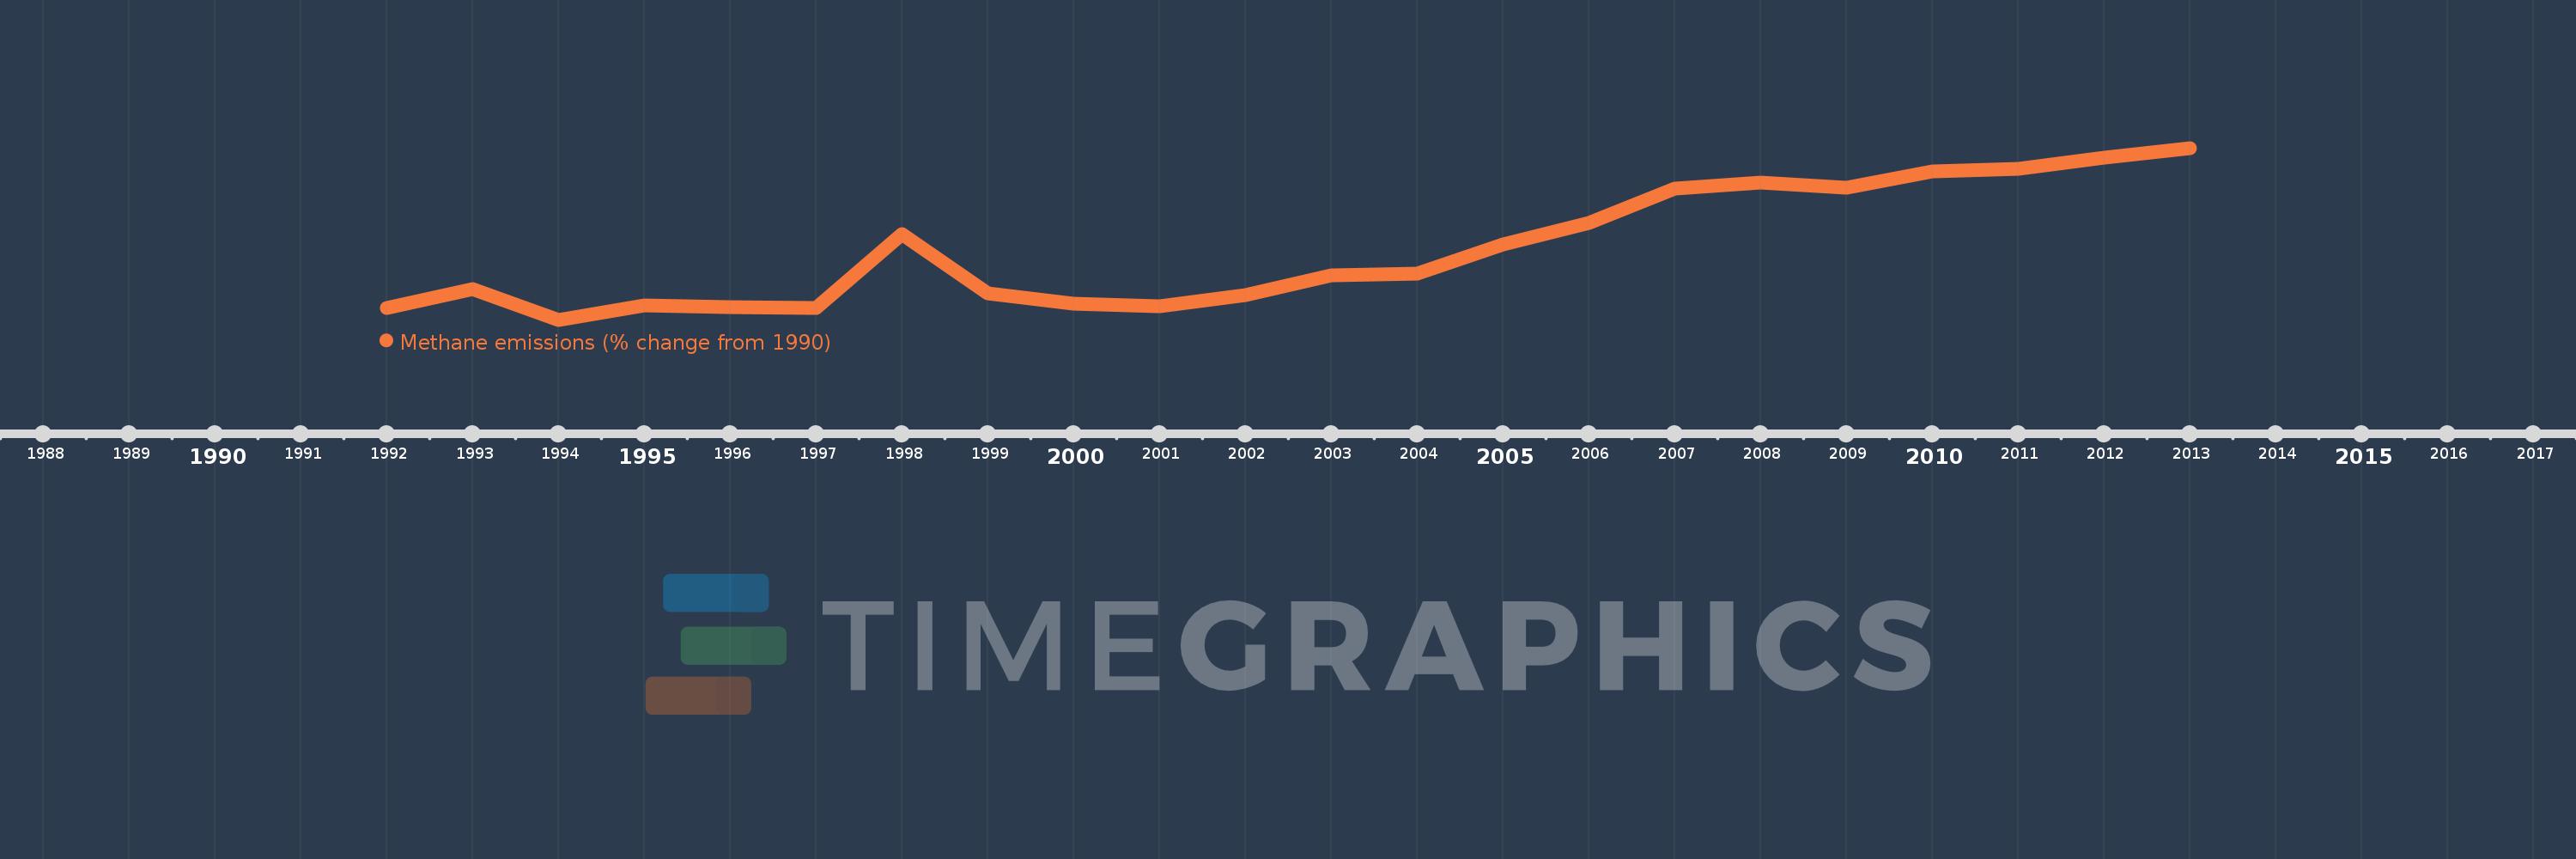
This timeline shows a graph from 1992 to 2013 of Low & middle income. No data until 1991. Number of actual observations by date: 22.
Source name:
World Development Indicators
Source organization:
World Bank staff estimates from original source: European Commission, Joint Research Centre (JRC)/Netherlands Environmental Assessment Agency (PBL). Emission Database for Global Atmospheric Research (EDGAR): http://edgar.jrc.ec.europa.eu/.
Categories, topics:
Climate Change, Environment
Last updated:
apr 23, 2017
Indicators value changes by year
Meaning:
15.067
Minimum:
-1.166
jan 1, 1994
Maximum:
38.614
jan 1, 2013
At the date of observation
Value
Absolute change
Change from the previous value
jan 1, 1992
1.543
+1.543
0.0%
jan 1, 1993
5.902
+4.359
282.4%
jan 1, 1994
-1.166
-7.068
-119.76%
jan 1, 1995
2.13
+3.296
-282.63%
jan 1, 1996
1.76
-0.37
-17.36%
jan 1, 1997
1.589
-0.171
-9.72%
jan 1, 1998
18.567
+16.978
1.07K%
jan 1, 1999
4.915
-13.651
-73.53%
jan 1, 2000
2.623
-2.293
-46.64%
jan 1, 2001
1.926
-0.697
-26.58%
jan 1, 2002
4.444
+2.519
130.79%
jan 1, 2003
9.12
+4.676
105.21%
jan 1, 2004
9.442
+0.322
3.53%
jan 1, 2005
16.308
+6.866
72.71%
jan 1, 2006
21.257
+4.949
30.35%
jan 1, 2007
29.297
+8.041
37.83%
jan 1, 2008
30.581
+1.284
4.38%
jan 1, 2009
29.452
-1.129
-3.69%
jan 1, 2010
33.148
+3.697
12.55%
jan 1, 2011
33.713
+0.565
1.7%
jan 1, 2012
36.309
+2.596
7.7%
jan 1, 2013
38.614
+2.305
6.35%
Ranking of countries by current statistics by years