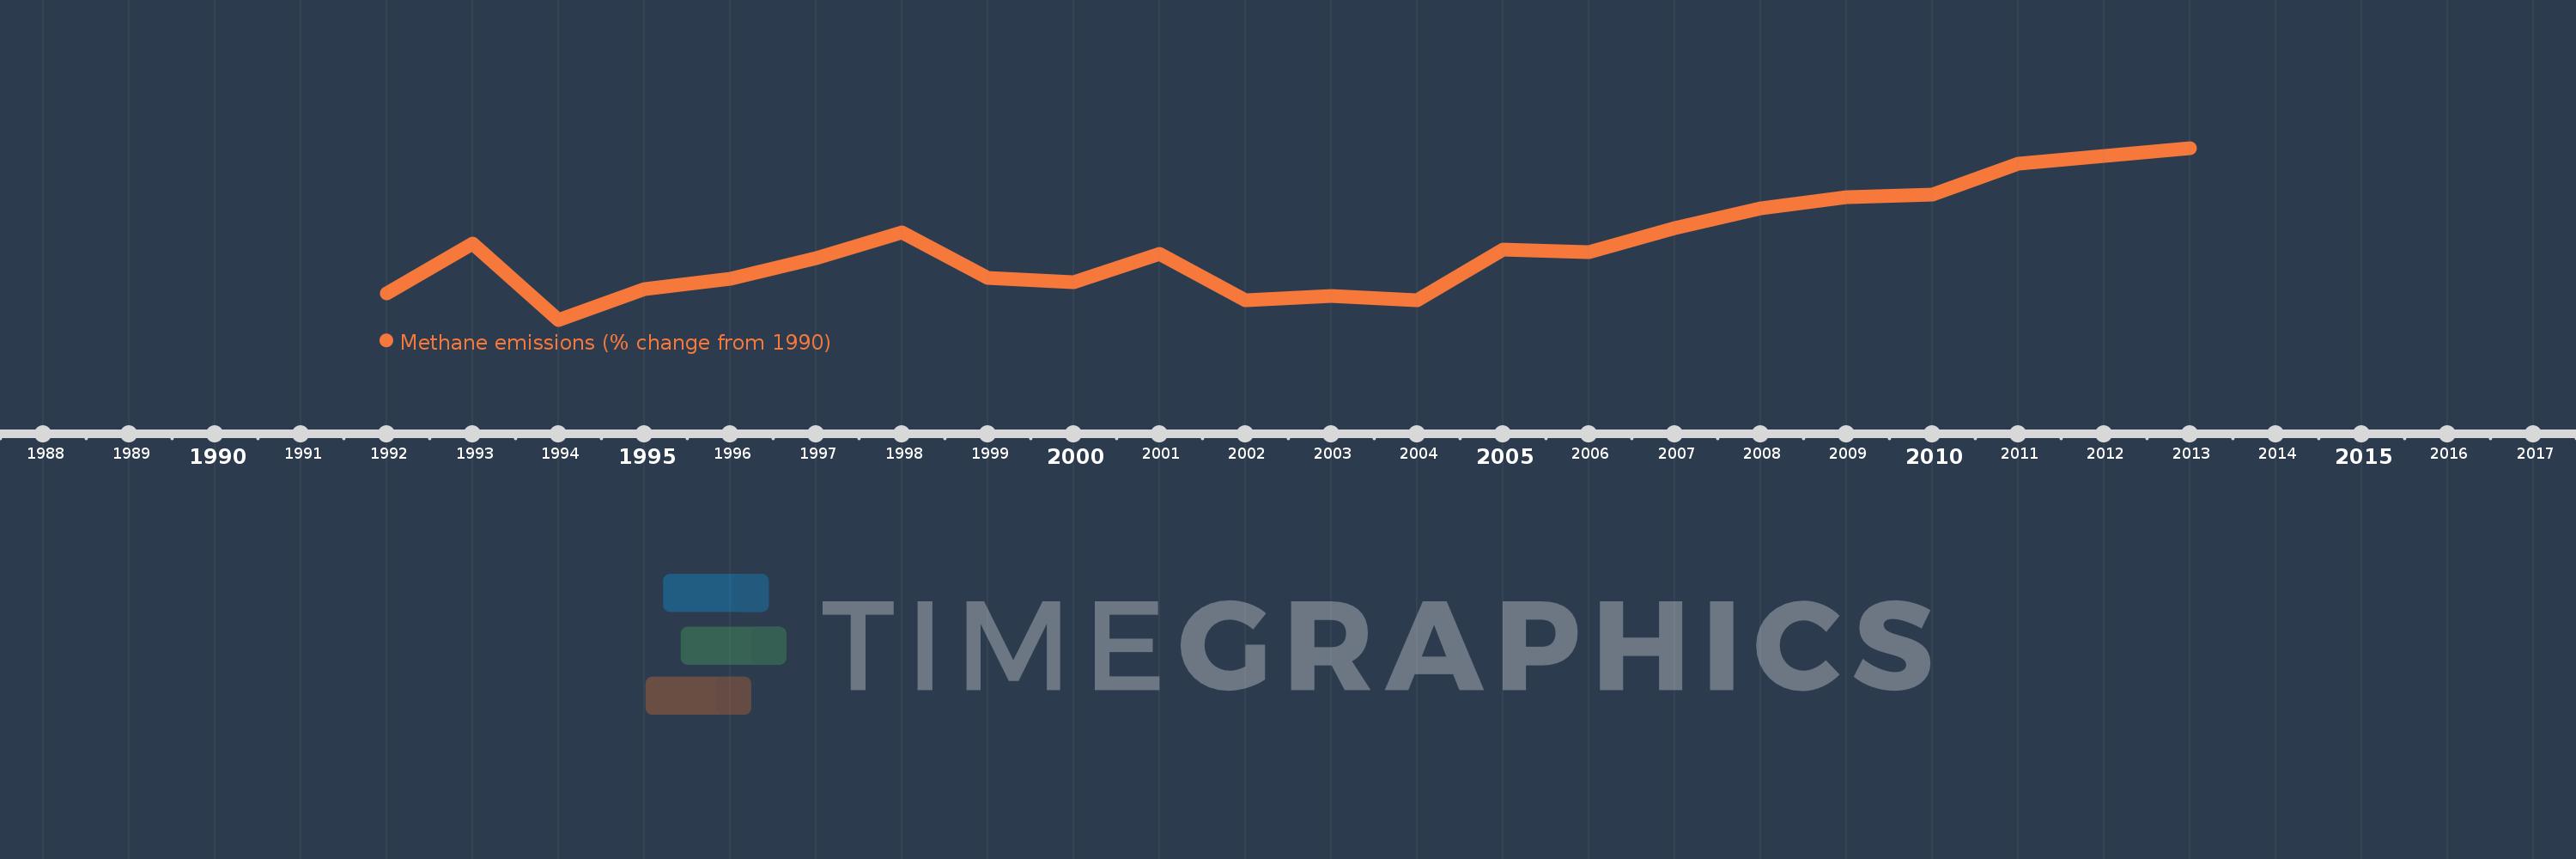
This timeline shows a graph from 1992 to 2013 of Swaziland. No data until 1991. Number of actual observations by date: 22.
Source name:
World Development Indicators
Source organization:
World Bank staff estimates from original source: European Commission, Joint Research Centre (JRC)/Netherlands Environmental Assessment Agency (PBL). Emission Database for Global Atmospheric Research (EDGAR): http://edgar.jrc.ec.europa.eu/.
Categories, topics:
Climate Change, Environment
Last updated:
apr 23, 2017
Indicators value changes by year
Meaning:
6.348
Minimum:
-4.88
jan 1, 1994
Maximum:
21.419
jan 1, 2013
At the date of observation
Value
Absolute change
Change from the previous value
jan 1, 1992
-0.812
-0.812
0.0%
jan 1, 1993
6.838
+7.65
-942.02%
jan 1, 1994
-4.88
-11.718
-171.36%
jan 1, 1995
-0.19
+4.689
-96.1%
jan 1, 1996
1.376
+1.567
-822.69%
jan 1, 1997
4.604
+3.228
234.53%
jan 1, 1998
8.43
+3.826
83.09%
jan 1, 1999
1.525
-6.906
-81.92%
jan 1, 2000
0.915
-0.609
-39.97%
jan 1, 2001
5.2
+4.284
468.11%
jan 1, 2002
-1.93
-7.13
-137.12%
jan 1, 2003
-1.172
+0.758
-39.29%
jan 1, 2004
-1.875
-0.704
60.05%
jan 1, 2005
5.923
+7.798
-415.8%
jan 1, 2006
5.454
-0.469
-7.92%
jan 1, 2007
9.146
+3.693
67.71%
jan 1, 2008
12.144
+2.998
32.78%
jan 1, 2009
13.933
+1.789
14.73%
jan 1, 2010
14.343
+0.41
2.94%
jan 1, 2011
19.038
+4.694
32.73%
jan 1, 2012
20.228
+1.19
6.25%
jan 1, 2013
21.419
+1.19
5.88%
Ranking of countries by current statistics by years