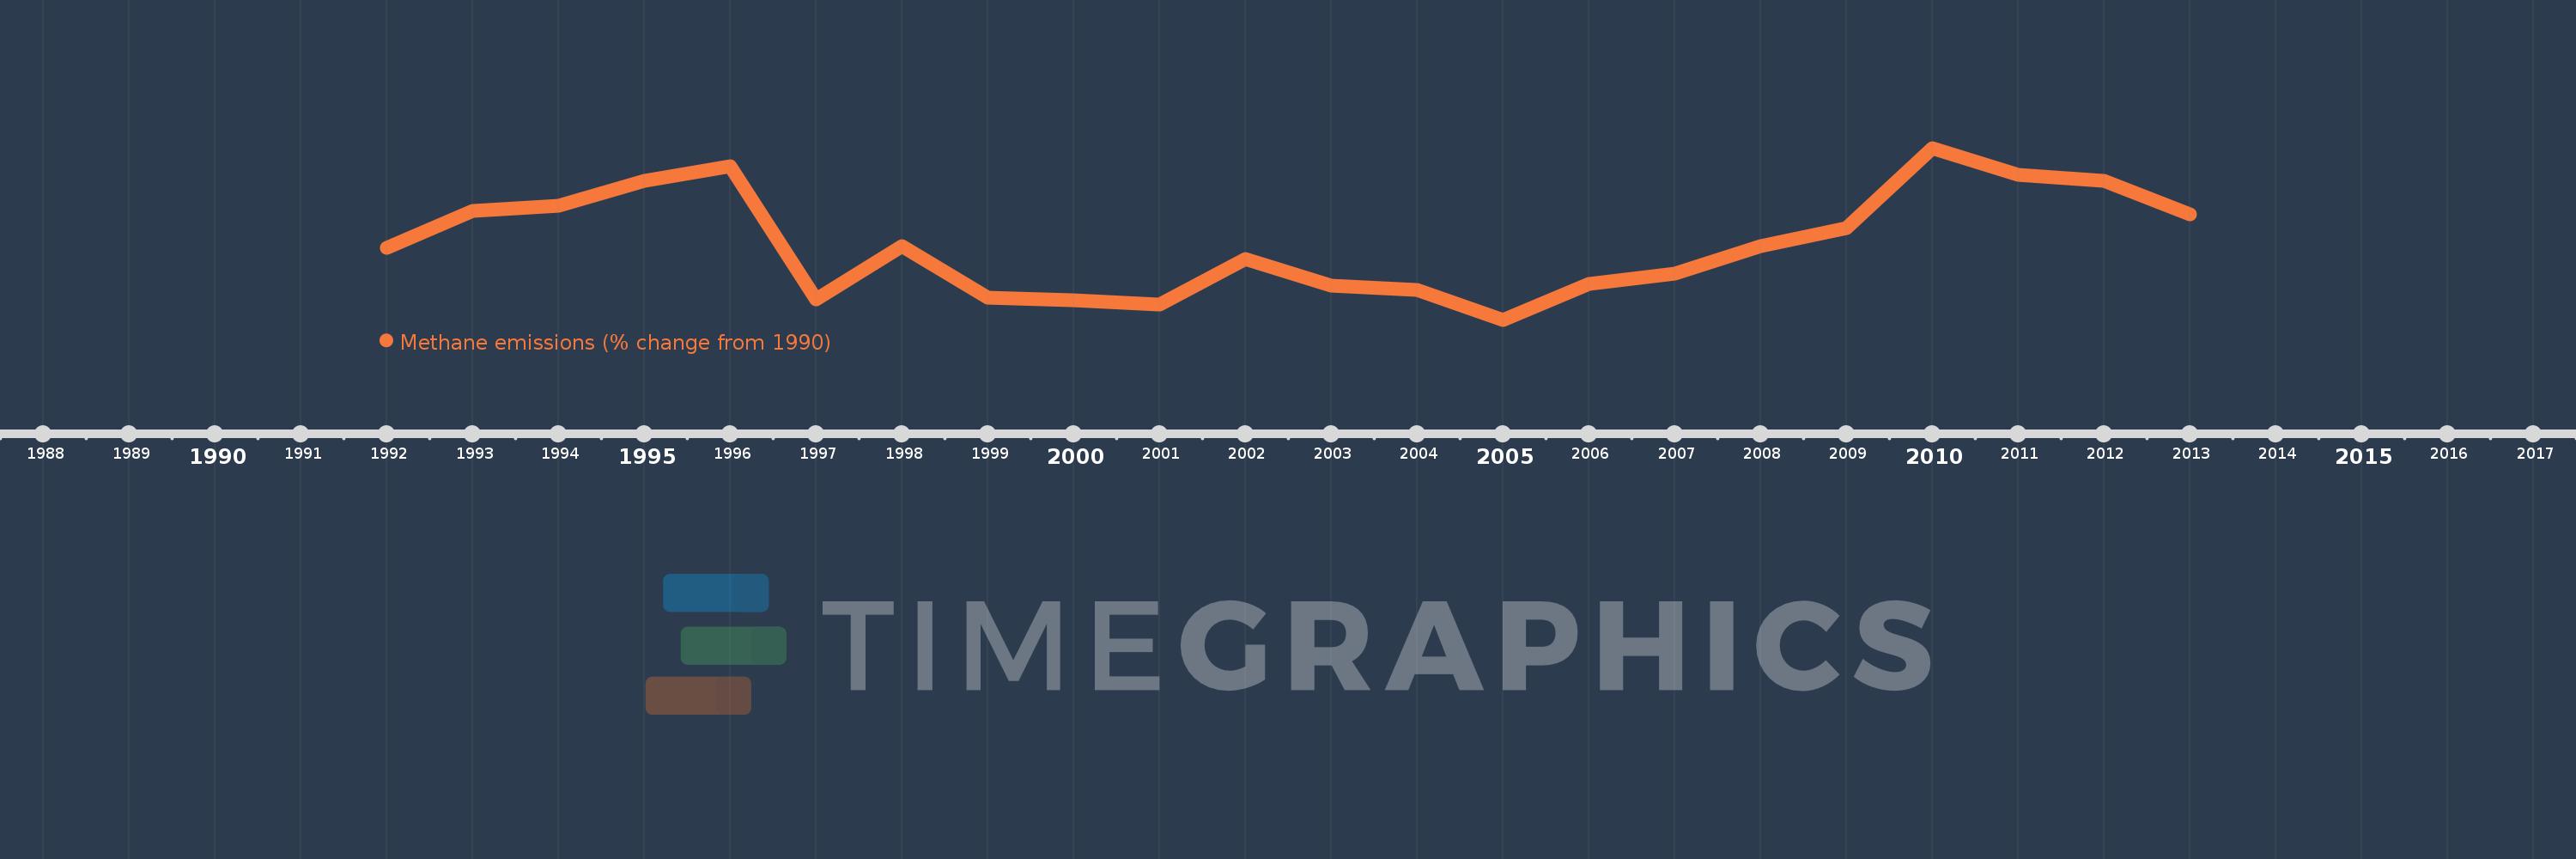
This timeline shows a graph from 1992 to 2013 of Luxembourg. No data until 1991. Number of actual observations by date: 22.
Source name:
World Development Indicators
Source organization:
World Bank staff estimates from original source: European Commission, Joint Research Centre (JRC)/Netherlands Environmental Assessment Agency (PBL). Emission Database for Global Atmospheric Research (EDGAR): http://edgar.jrc.ec.europa.eu/.
Categories, topics:
Climate Change, Environment
Last updated:
apr 23, 2017
Indicators value changes by year
Meaning:
14.384
Minimum:
1.469
jan 1, 2005
Maximum:
30.684
jan 1, 2010
At the date of observation
Value
Absolute change
Change from the previous value
jan 1, 1992
13.681
+13.681
0.0%
jan 1, 1993
19.971
+6.291
45.98%
jan 1, 1994
20.878
+0.907
4.54%
jan 1, 1995
25.027
+4.149
19.87%
jan 1, 1996
27.548
+2.521
10.07%
jan 1, 1997
5.003
-22.545
-81.84%
jan 1, 1998
13.924
+8.921
178.32%
jan 1, 1999
5.229
-8.694
-62.44%
jan 1, 2000
4.822
-0.407
-7.79%
jan 1, 2001
4.014
-0.808
-16.75%
jan 1, 2002
11.799
+7.785
193.92%
jan 1, 2003
7.309
-4.49
-38.05%
jan 1, 2004
6.59
-0.719
-9.83%
jan 1, 2005
1.469
-5.122
-77.71%
jan 1, 2006
7.547
+6.078
413.87%
jan 1, 2007
9.291
+1.744
23.11%
jan 1, 2008
13.995
+4.704
50.63%
jan 1, 2009
17.063
+3.068
21.92%
jan 1, 2010
30.684
+13.621
79.83%
jan 1, 2011
26.178
-4.506
-14.68%
jan 1, 2012
25.04
-1.139
-4.35%
jan 1, 2013
19.394
-5.645
-22.55%
Ranking of countries by current statistics by years