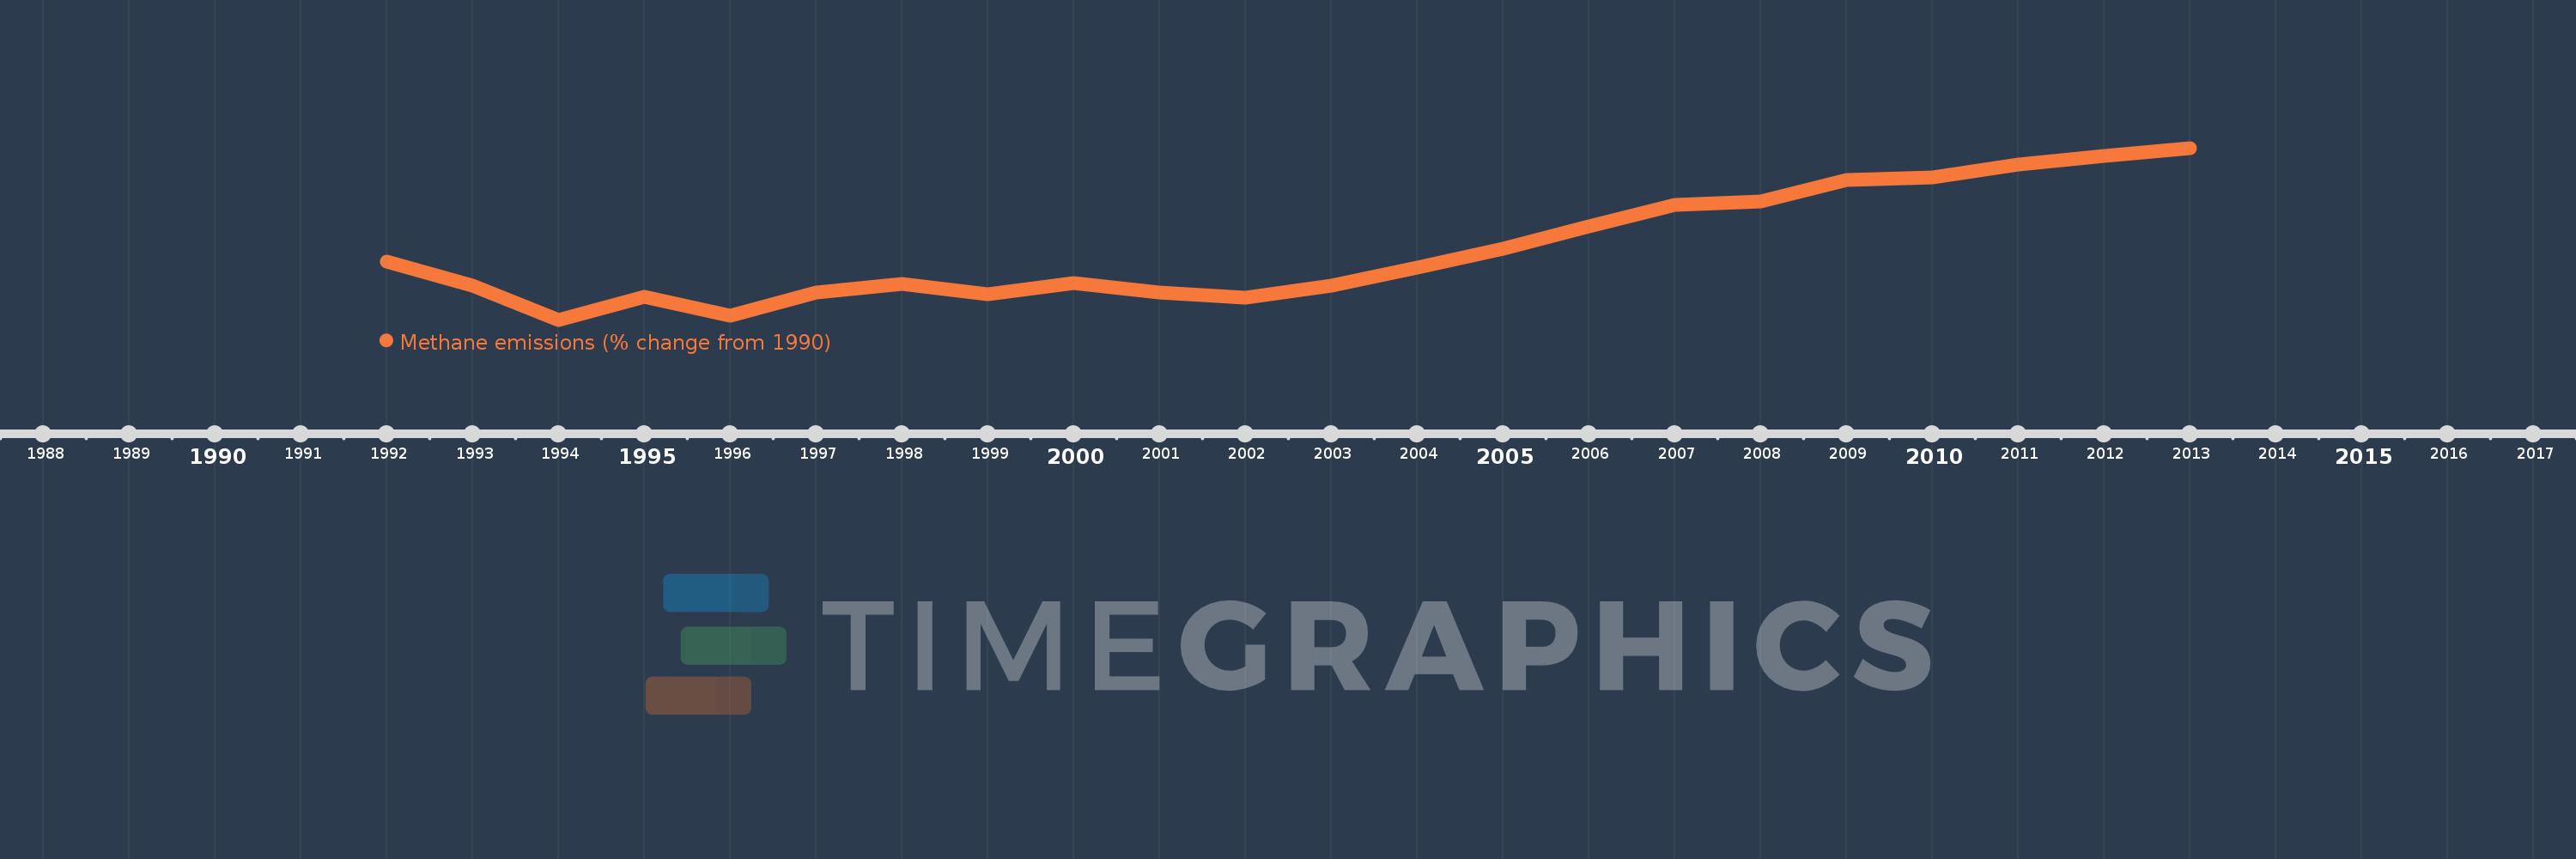
This timeline shows a graph from 1992 to 2013 of Armenia. No data until 1991. Number of actual observations by date: 22.
Source name:
World Development Indicators
Source organization:
World Bank staff estimates from original source: European Commission, Joint Research Centre (JRC)/Netherlands Environmental Assessment Agency (PBL). Emission Database for Global Atmospheric Research (EDGAR): http://edgar.jrc.ec.europa.eu/.
Categories, topics:
Climate Change, Environment
Last updated:
apr 23, 2017
Indicators value changes by year
Meaning:
-2.361
Minimum:
-16.913
jan 1, 1994
Maximum:
18.548
jan 1, 2013
At the date of observation
Value
Absolute change
Change from the previous value
jan 1, 1992
-4.993
-4.993
0.0%
jan 1, 1993
-9.845
-4.852
97.17%
jan 1, 1994
-16.913
-7.068
71.8%
jan 1, 1995
-12.2
+4.713
-27.87%
jan 1, 1996
-15.998
-3.798
31.13%
jan 1, 1997
-11.357
+4.641
-29.01%
jan 1, 1998
-9.562
+1.795
-15.8%
jan 1, 1999
-11.681
-2.119
22.16%
jan 1, 2000
-9.359
+2.321
-19.87%
jan 1, 2001
-11.224
-1.865
19.92%
jan 1, 2002
-12.32
-1.096
9.76%
jan 1, 2003
-9.879
+2.441
-19.81%
jan 1, 2004
-6.119
+3.76
-38.06%
jan 1, 2005
-2.181
+3.938
-64.36%
jan 1, 2006
2.441
+4.621
-211.93%
jan 1, 2007
6.729
+4.288
175.7%
jan 1, 2008
7.476
+0.747
11.1%
jan 1, 2009
11.946
+4.47
59.8%
jan 1, 2010
12.484
+0.538
4.5%
jan 1, 2011
15.193
+2.709
21.7%
jan 1, 2012
16.87
+1.678
11.04%
jan 1, 2013
18.548
+1.677
9.94%
Ranking of countries by current statistics by years