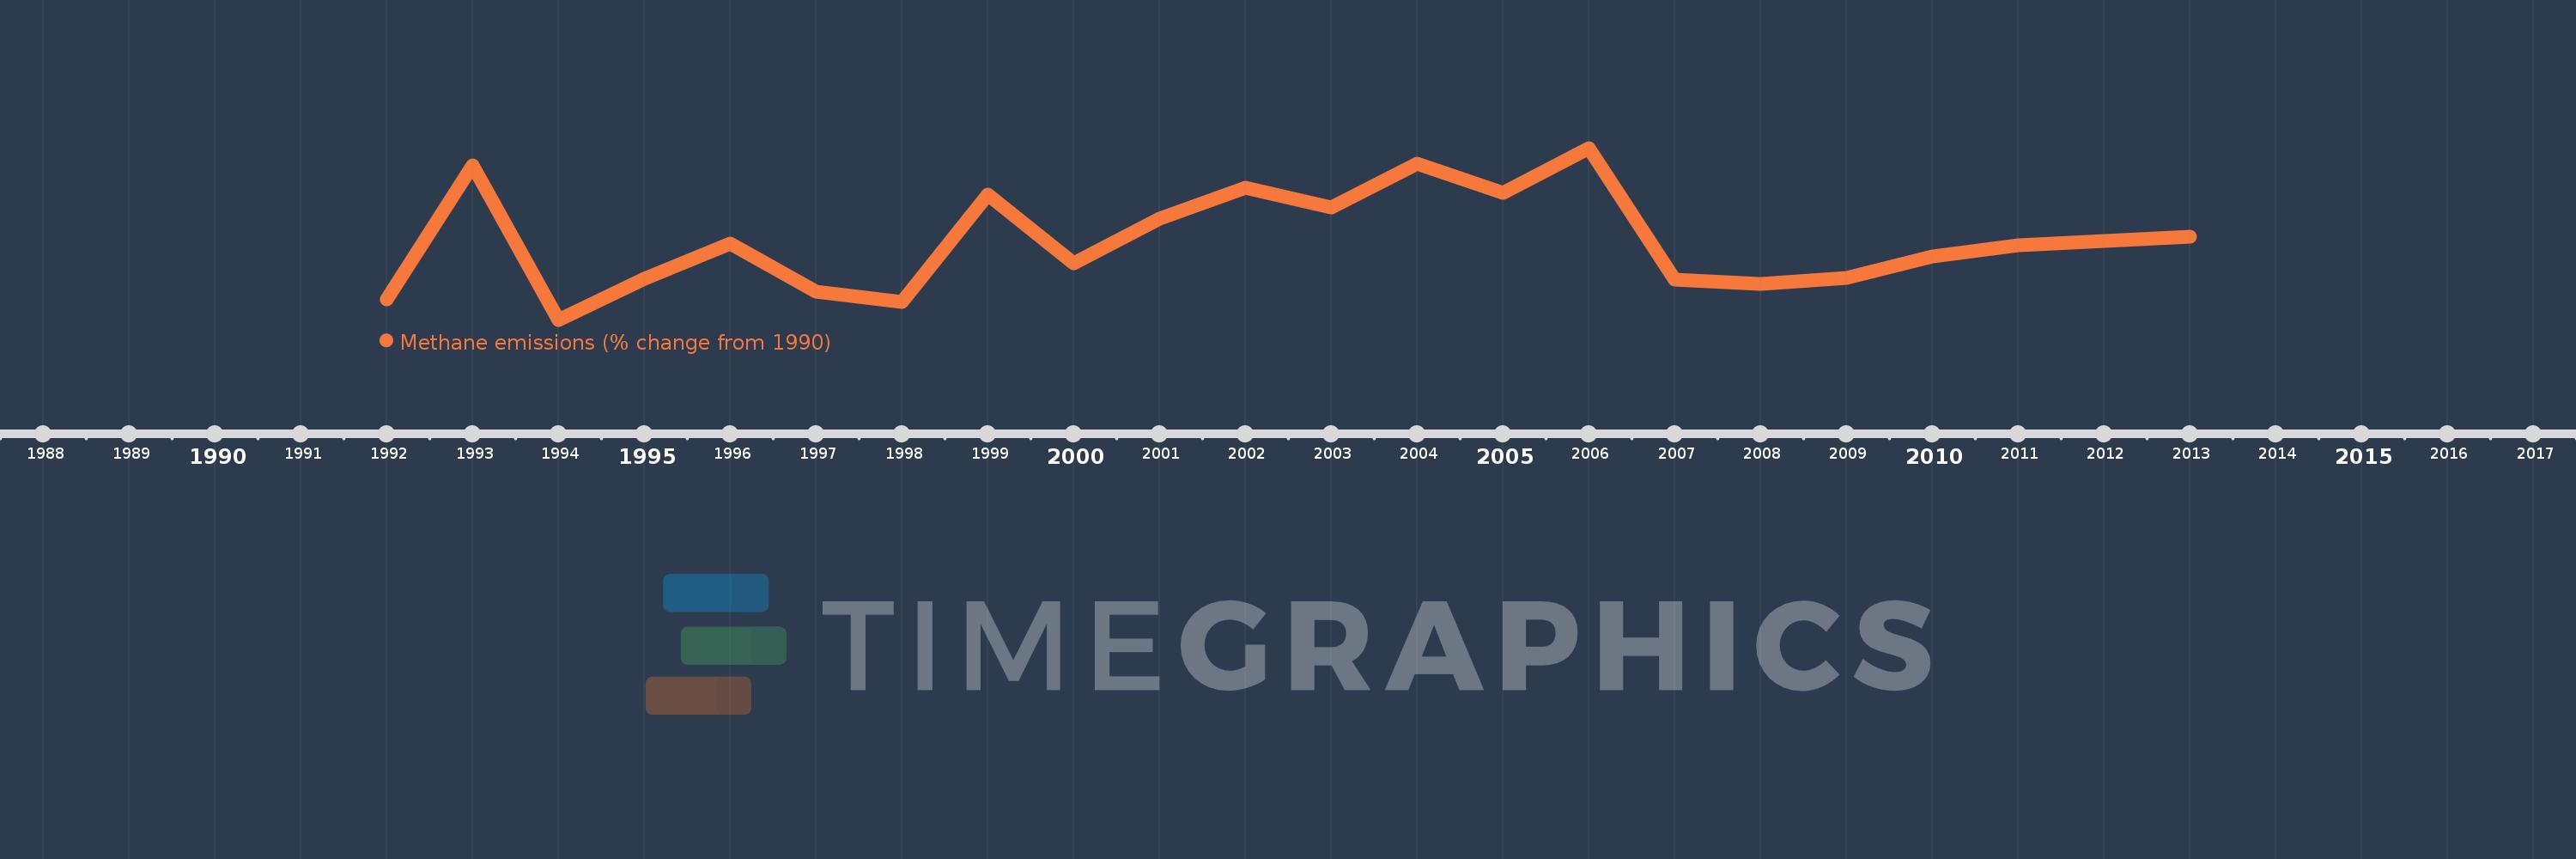
This timeline shows a graph from 1992 to 2013 of Tanzania. No data until 1991. Number of actual observations by date: 22.
Source name:
World Development Indicators
Source organization:
World Bank staff estimates from original source: European Commission, Joint Research Centre (JRC)/Netherlands Environmental Assessment Agency (PBL). Emission Database for Global Atmospheric Research (EDGAR): http://edgar.jrc.ec.europa.eu/.
Categories, topics:
Climate Change, Environment
Last updated:
apr 23, 2017
Indicators value changes by year
Meaning:
3.096
Minimum:
-15.489
jan 1, 1994
Maximum:
24.986
jan 1, 2006
At the date of observation
Value
Absolute change
Change from the previous value
jan 1, 1992
-10.602
-10.602
0.0%
jan 1, 1993
20.791
+31.393
-296.1%
jan 1, 1994
-15.489
-36.28
-174.5%
jan 1, 1995
-5.879
+9.61
-62.04%
jan 1, 1996
2.527
+8.406
-142.98%
jan 1, 1997
-8.964
-11.491
-454.75%
jan 1, 1998
-11.248
-2.284
25.48%
jan 1, 1999
13.993
+25.241
-224.41%
jan 1, 2000
-2.236
-16.229
-115.98%
jan 1, 2001
8.303
+10.539
-471.37%
jan 1, 2002
15.672
+7.369
88.76%
jan 1, 2003
10.864
-4.808
-30.68%
jan 1, 2004
21.219
+10.355
95.32%
jan 1, 2005
14.366
-6.853
-32.3%
jan 1, 2006
24.986
+10.62
73.93%
jan 1, 2007
-6.12
-31.106
-124.49%
jan 1, 2008
-6.987
-0.868
14.18%
jan 1, 2009
-5.694
+1.293
-18.5%
jan 1, 2010
-0.626
+5.069
-89.01%
jan 1, 2011
2.061
+2.686
-429.23%
jan 1, 2012
3.081
+1.021
49.53%
jan 1, 2013
4.102
+1.021
33.12%
Ranking of countries by current statistics by years