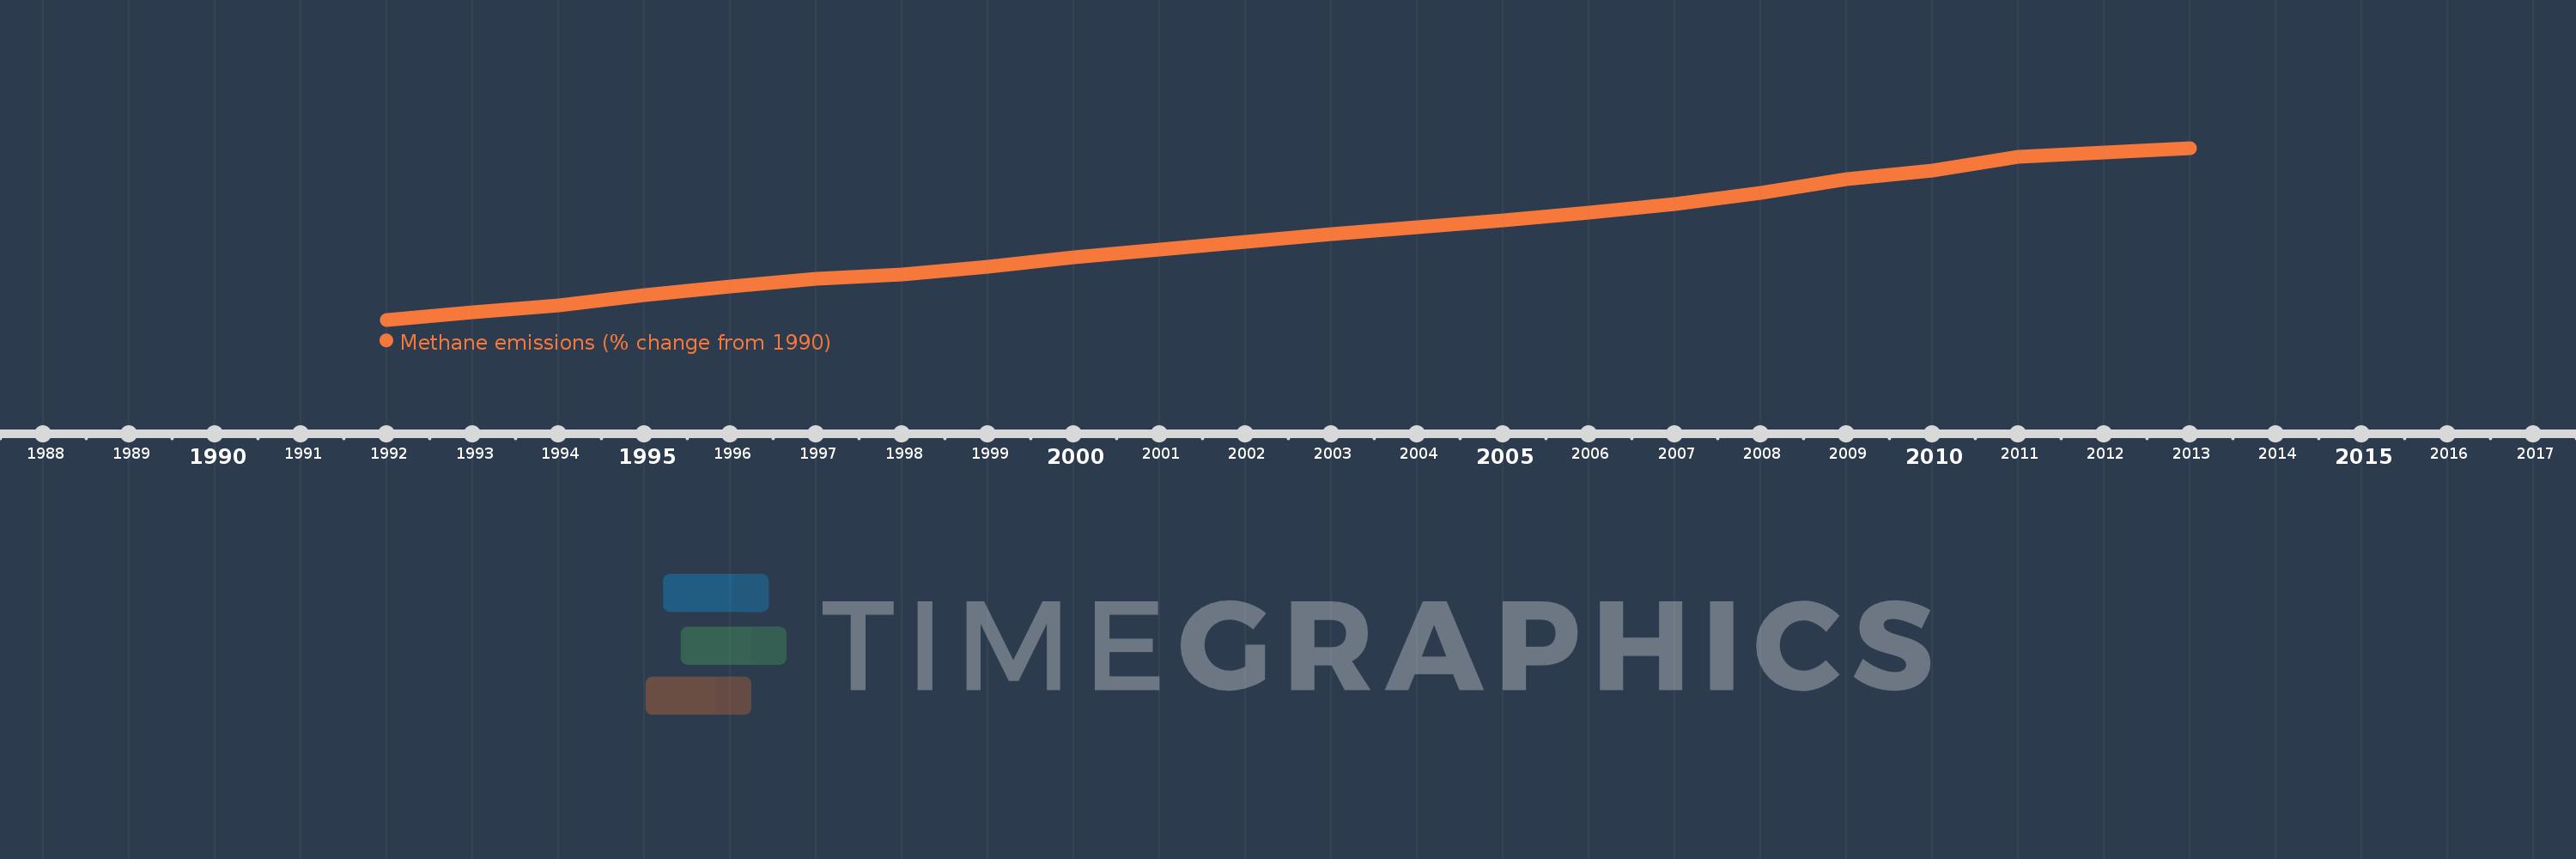
This timeline shows a graph from 1992 to 2013 of Cayman Islands. No data until 1991. Number of actual observations by date: 22.
Source name:
World Development Indicators
Source organization:
World Bank staff estimates from original source: European Commission, Joint Research Centre (JRC)/Netherlands Environmental Assessment Agency (PBL). Emission Database for Global Atmospheric Research (EDGAR): http://edgar.jrc.ec.europa.eu/.
Categories, topics:
Climate Change, Environment
Last updated:
apr 23, 2017
Indicators value changes by year
Meaning:
31.358
Minimum:
0.788
jan 1, 1992
Maximum:
63.287
jan 1, 2013
At the date of observation
Value
Absolute change
Change from the previous value
jan 1, 1992
0.788
+0.788
0.0%
jan 1, 1993
3.605
+2.817
357.25%
jan 1, 1994
6.069
+2.464
68.34%
jan 1, 1995
9.836
+3.767
62.06%
jan 1, 1996
12.95
+3.114
31.66%
jan 1, 1997
15.649
+2.699
20.84%
jan 1, 1998
17.381
+1.732
11.07%
jan 1, 1999
20.126
+2.745
15.79%
jan 1, 2000
23.468
+3.343
16.61%
jan 1, 2001
26.357
+2.889
12.31%
jan 1, 2002
29.038
+2.681
10.17%
jan 1, 2003
31.857
+2.819
9.71%
jan 1, 2004
34.339
+2.482
7.79%
jan 1, 2005
37.009
+2.67
7.77%
jan 1, 2006
39.628
+2.62
7.08%
jan 1, 2007
42.73
+3.101
7.83%
jan 1, 2008
47.093
+4.364
10.21%
jan 1, 2009
51.957
+4.863
10.33%
jan 1, 2010
54.929
+2.973
5.72%
jan 1, 2011
60.085
+5.156
9.39%
jan 1, 2012
61.686
+1.601
2.66%
jan 1, 2013
63.287
+1.601
2.6%
Ranking of countries by current statistics by years