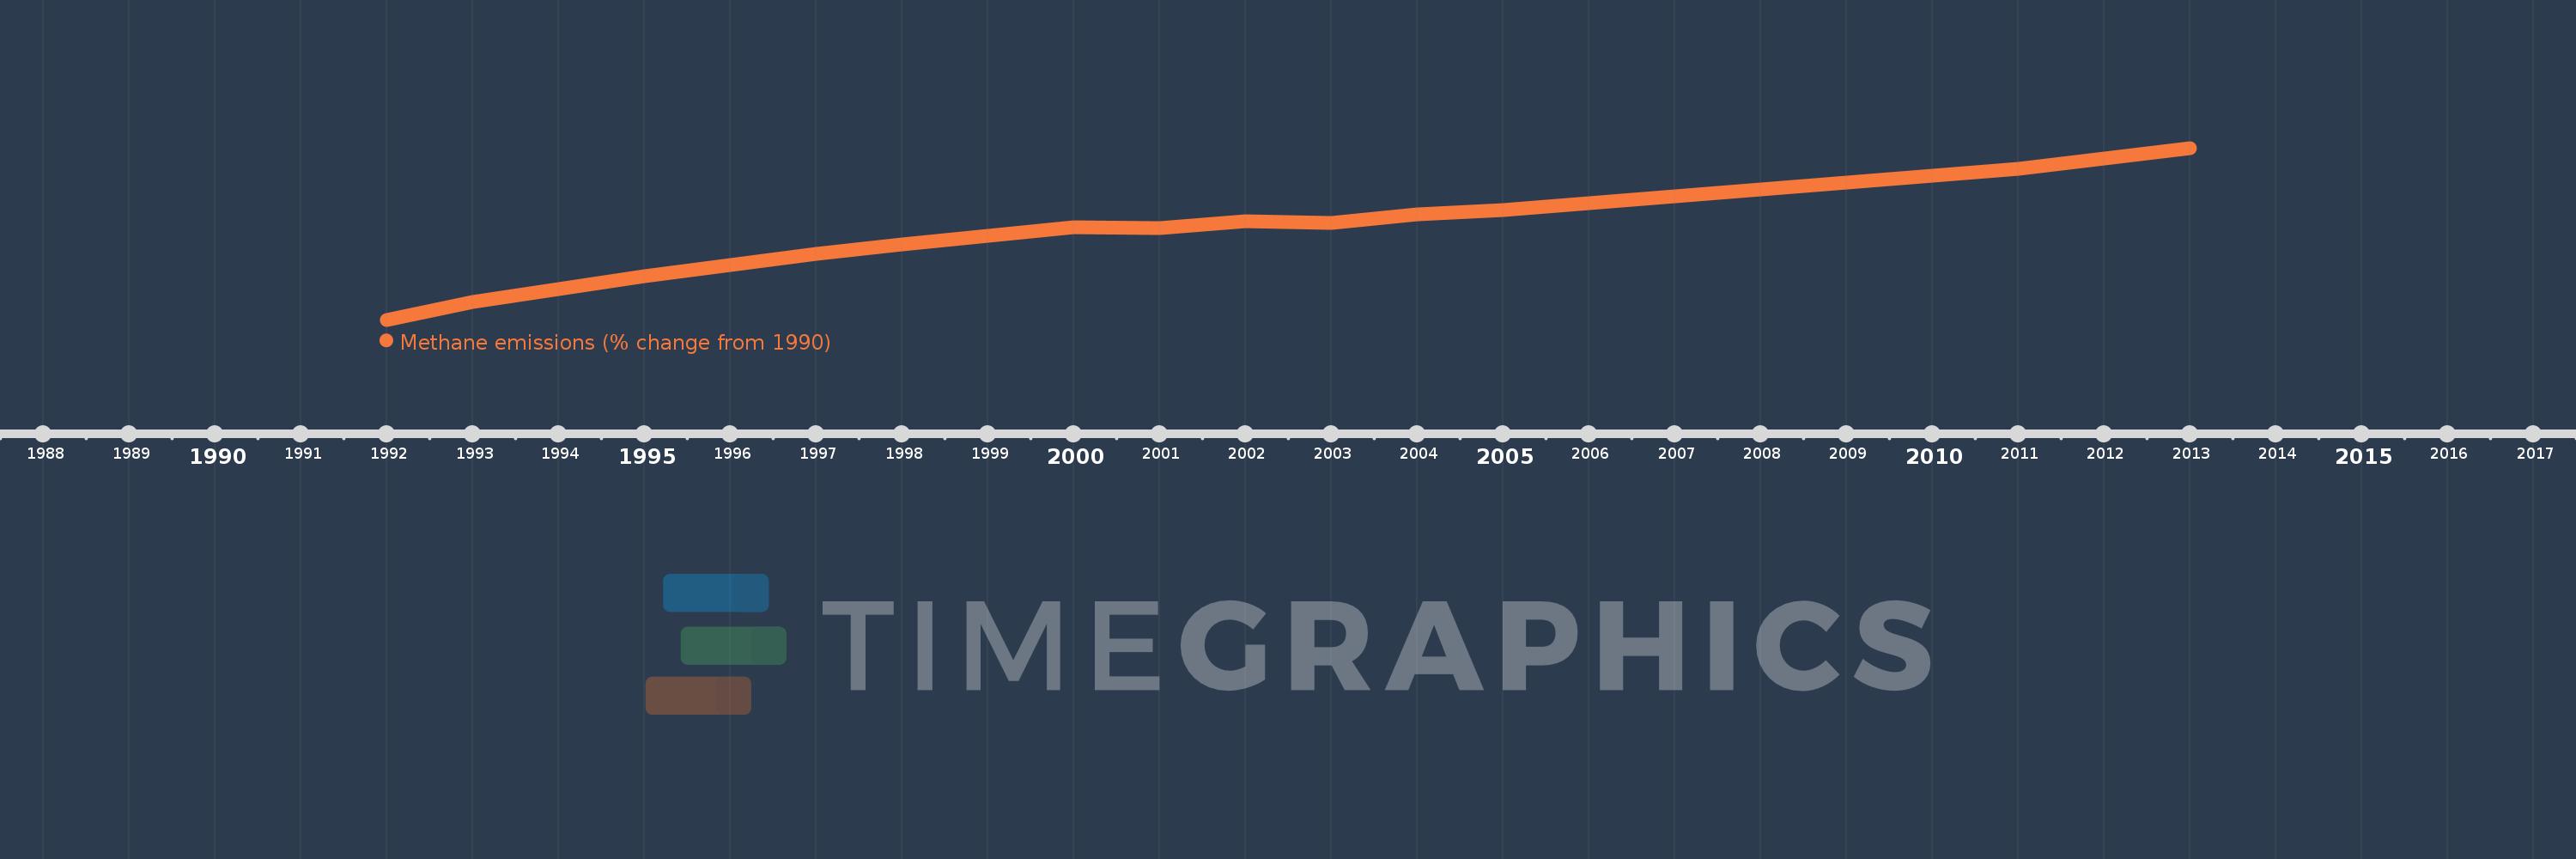
This timeline shows a graph from 1992 to 2013 of Greenland. No data until 1991. Number of actual observations by date: 22.
Source name:
World Development Indicators
Source organization:
World Bank staff estimates from original source: European Commission, Joint Research Centre (JRC)/Netherlands Environmental Assessment Agency (PBL). Emission Database for Global Atmospheric Research (EDGAR): http://edgar.jrc.ec.europa.eu/.
Categories, topics:
Climate Change, Environment
Last updated:
apr 23, 2017
Indicators value changes by year
Meaning:
12.541
Minimum:
1.716
jan 1, 1992
Maximum:
21.175
jan 1, 2013
At the date of observation
Value
Absolute change
Change from the previous value
jan 1, 1992
1.716
+1.716
0.0%
jan 1, 1993
3.707
+1.991
115.97%
jan 1, 1994
5.234
+1.527
41.2%
jan 1, 1995
6.644
+1.409
26.92%
jan 1, 1996
7.943
+1.299
19.55%
jan 1, 1997
9.148
+1.206
15.18%
jan 1, 1998
10.272
+1.124
12.28%
jan 1, 1999
11.259
+0.987
9.61%
jan 1, 2000
12.164
+0.904
8.03%
jan 1, 2001
12.116
-0.048
-0.4%
jan 1, 2002
12.865
+0.749
6.19%
jan 1, 2003
12.66
-0.205
-1.59%
jan 1, 2004
13.653
+0.993
7.84%
jan 1, 2005
14.187
+0.534
3.91%
jan 1, 2006
14.934
+0.747
5.27%
jan 1, 2007
15.684
+0.75
5.02%
jan 1, 2008
16.481
+0.797
5.08%
jan 1, 2009
17.253
+0.772
4.68%
jan 1, 2010
18.026
+0.773
4.48%
jan 1, 2011
18.799
+0.773
4.29%
jan 1, 2012
19.987
+1.188
6.32%
jan 1, 2013
21.175
+1.188
5.94%
Ranking of countries by current statistics by years