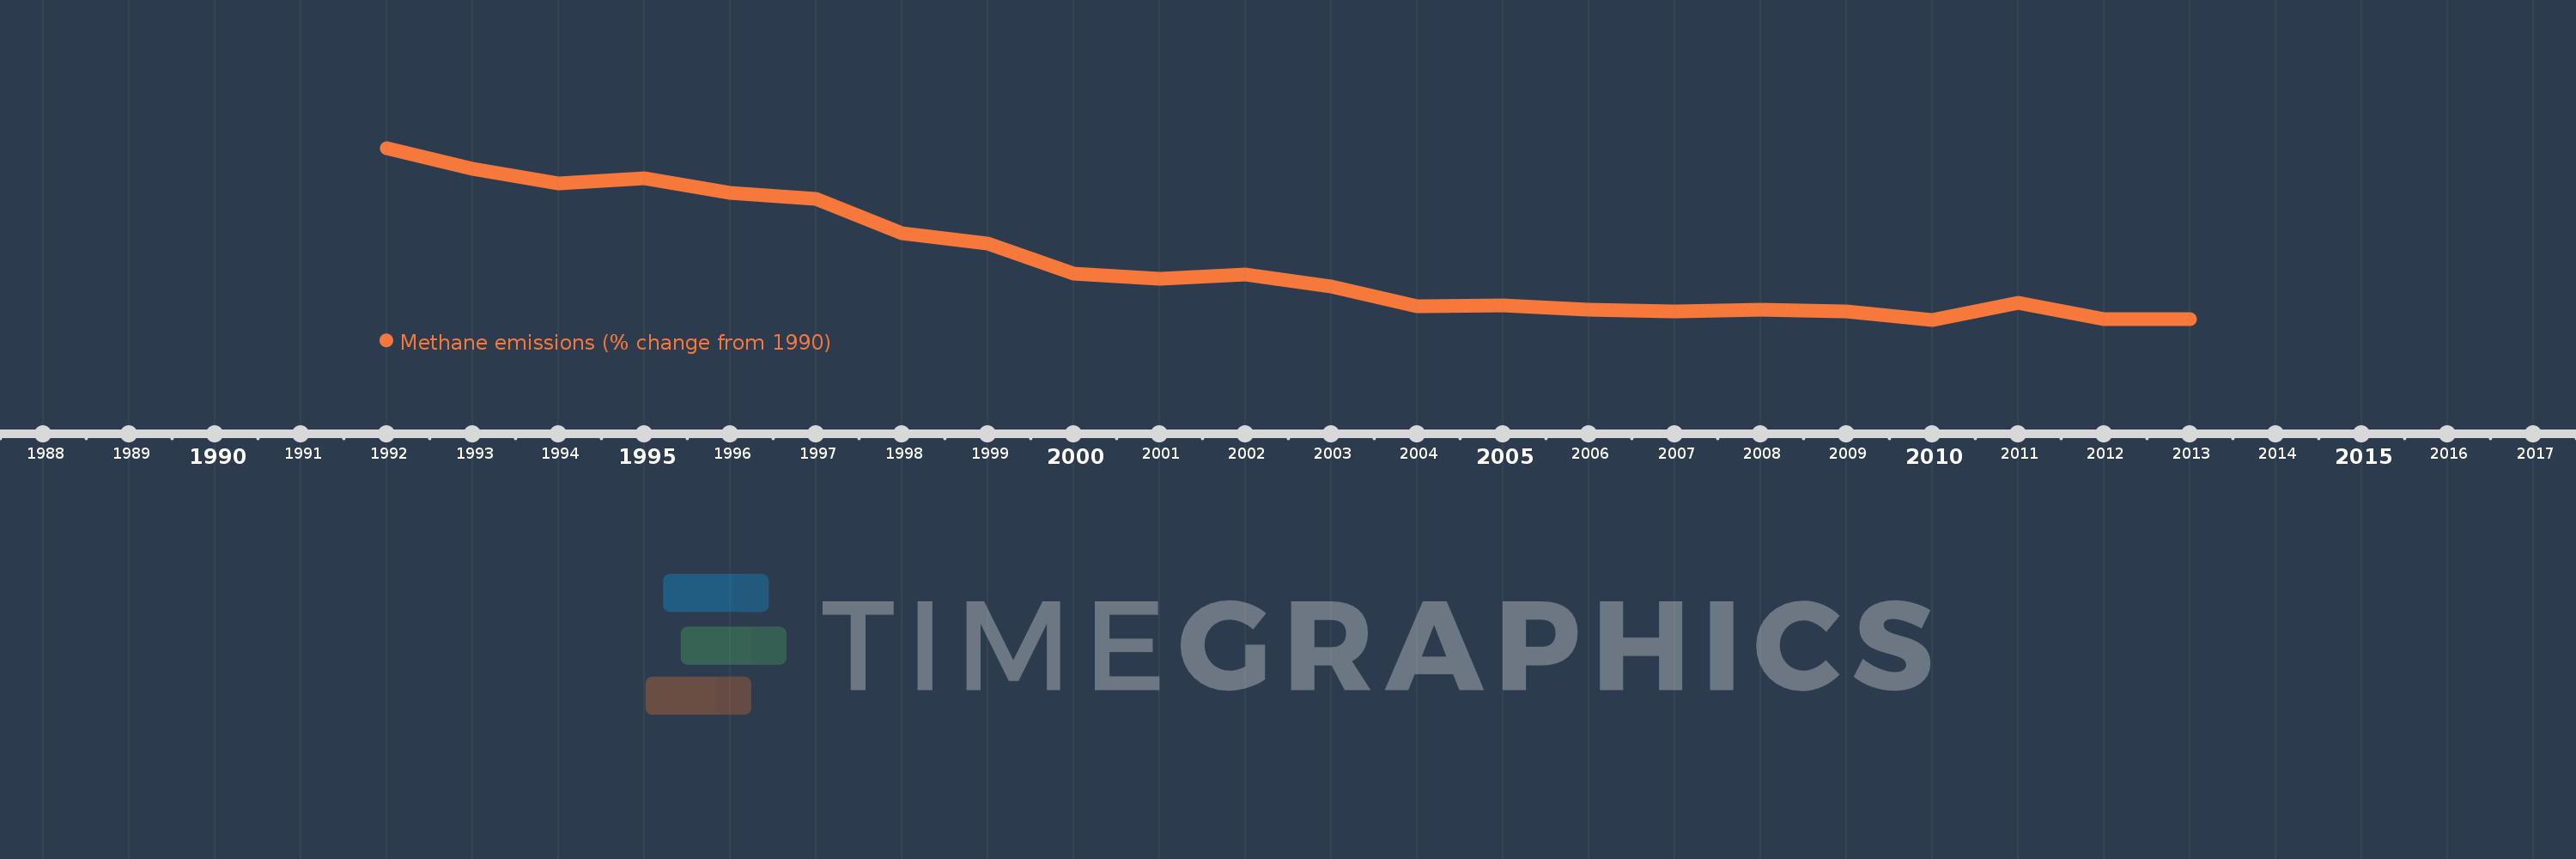
This timeline shows a graph from 1992 to 2013 of Switzerland. No data until 1991. Number of actual observations by date: 22.
Source name:
World Development Indicators
Source organization:
World Bank staff estimates from original source: European Commission, Joint Research Centre (JRC)/Netherlands Environmental Assessment Agency (PBL). Emission Database for Global Atmospheric Research (EDGAR): http://edgar.jrc.ec.europa.eu/.
Categories, topics:
Climate Change, Environment
Last updated:
apr 23, 2017
Indicators value changes by year
Meaning:
-11.628
Minimum:
-17.084
jan 1, 2010
Maximum:
-0.701
jan 1, 1992
At the date of observation
Value
Absolute change
Change from the previous value
jan 1, 1992
-0.701
-0.701
0.0%
jan 1, 1993
-2.671
-1.971
281.16%
jan 1, 1994
-4.08
-1.409
52.73%
jan 1, 1995
-3.574
+0.506
-12.41%
jan 1, 1996
-4.974
-1.4
39.16%
jan 1, 1997
-5.594
-0.621
12.48%
jan 1, 1998
-8.807
-3.212
57.42%
jan 1, 1999
-9.797
-0.99
11.24%
jan 1, 2000
-12.723
-2.926
29.87%
jan 1, 2001
-13.215
-0.492
3.87%
jan 1, 2002
-12.804
+0.411
-3.11%
jan 1, 2003
-13.923
-1.119
8.74%
jan 1, 2004
-15.771
-1.848
13.27%
jan 1, 2005
-15.733
+0.038
-0.24%
jan 1, 2006
-16.132
-0.399
2.53%
jan 1, 2007
-16.286
-0.154
0.95%
jan 1, 2008
-16.151
+0.135
-0.83%
jan 1, 2009
-16.259
-0.108
0.67%
jan 1, 2010
-17.084
-0.824
5.07%
jan 1, 2011
-15.486
+1.598
-9.35%
jan 1, 2012
-17.001
-1.515
9.78%
jan 1, 2013
-17.044
-0.043
0.25%
Ranking of countries by current statistics by years