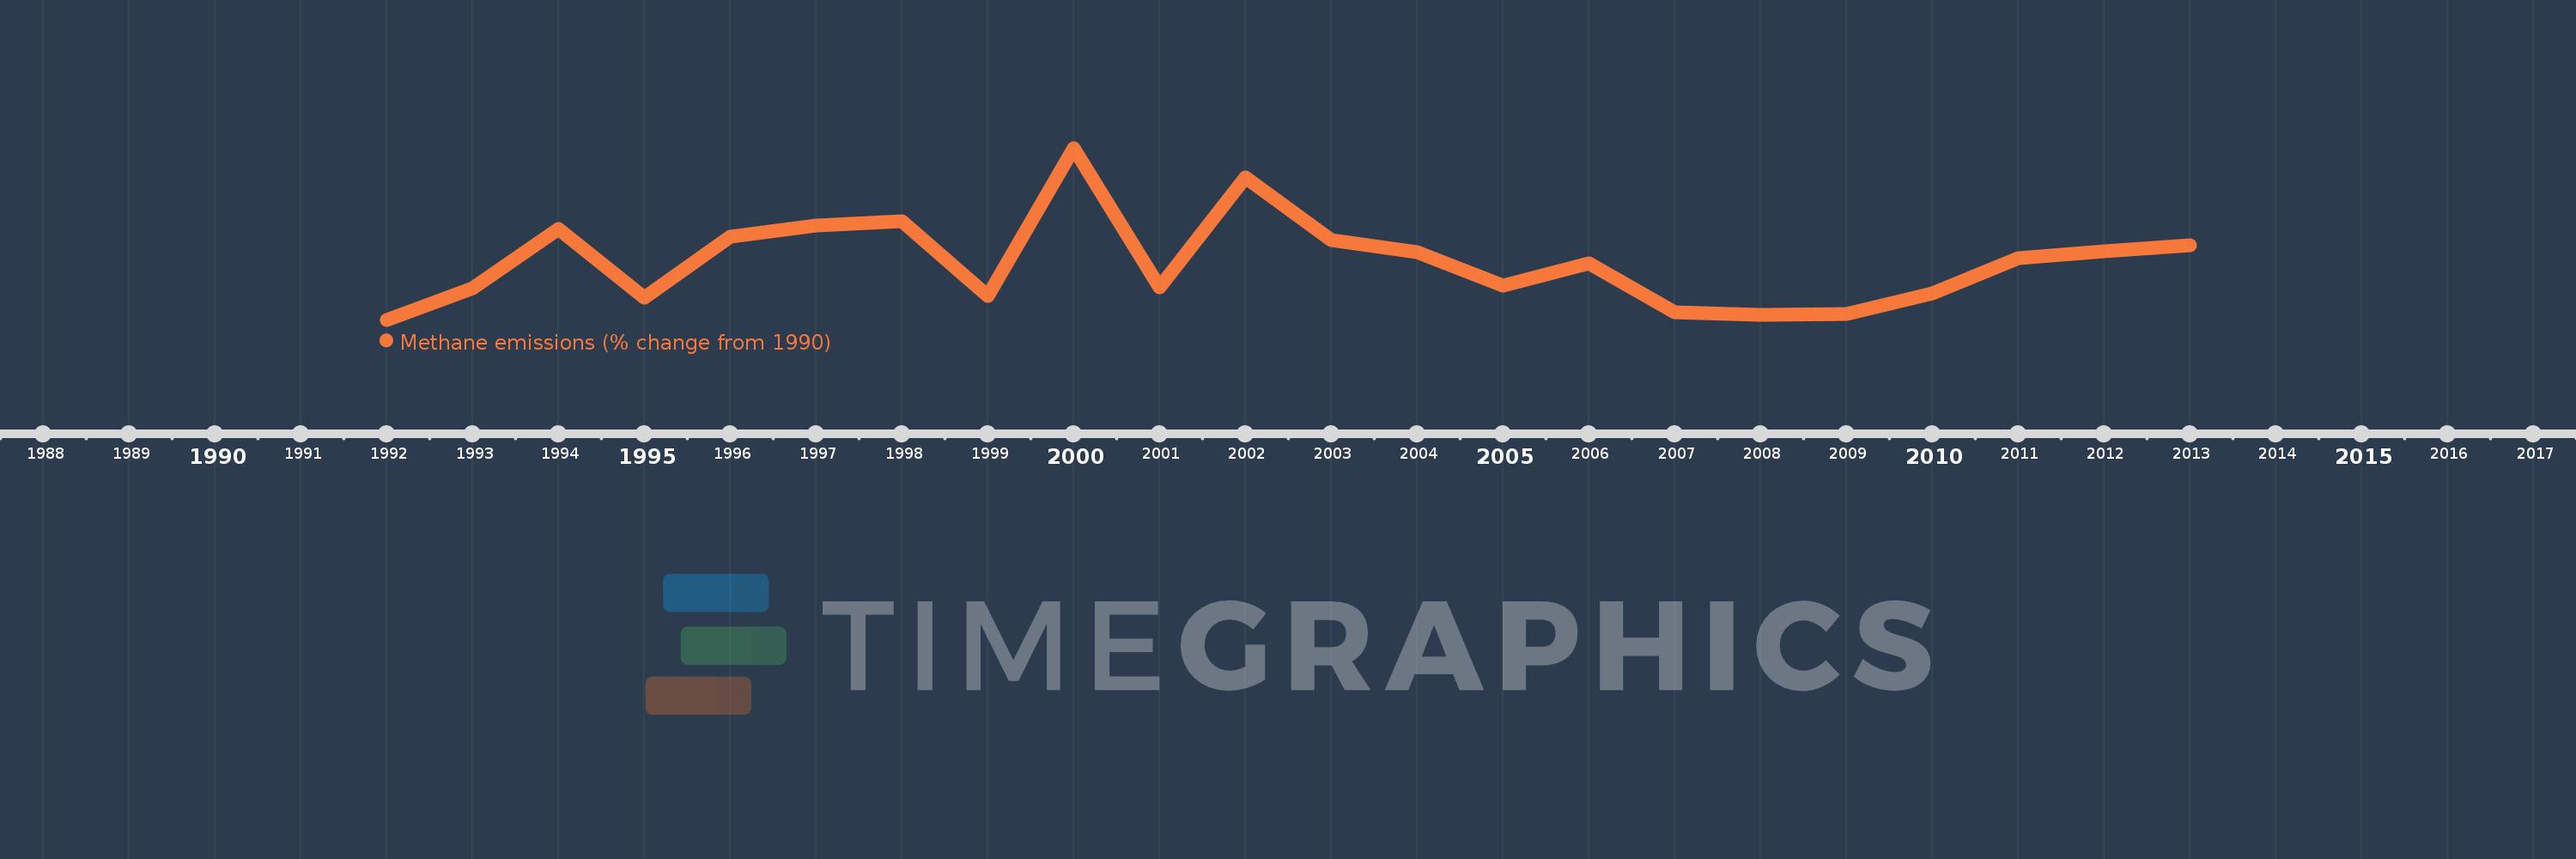
This timeline shows a graph from 1992 to 2013 of Paraguay. No data until 1991. Number of actual observations by date: 22.
Source name:
World Development Indicators
Source organization:
World Bank staff estimates from original source: European Commission, Joint Research Centre (JRC)/Netherlands Environmental Assessment Agency (PBL). Emission Database for Global Atmospheric Research (EDGAR): http://edgar.jrc.ec.europa.eu/.
Categories, topics:
Climate Change, Environment
Last updated:
apr 23, 2017
Indicators value changes by year
Meaning:
2.129
Minimum:
-7.273
jan 1, 1992
Maximum:
20.572
jan 1, 2000
At the date of observation
Value
Absolute change
Change from the previous value
jan 1, 1992
-7.273
-7.273
0.0%
jan 1, 1993
-2.222
+5.051
-69.45%
jan 1, 1994
7.403
+9.625
-433.22%
jan 1, 1995
-3.707
-11.11
-150.07%
jan 1, 1996
6.202
+9.908
-267.3%
jan 1, 1997
7.951
+1.75
28.21%
jan 1, 1998
8.745
+0.794
9.98%
jan 1, 1999
-3.477
-12.222
-139.76%
jan 1, 2000
20.572
+24.049
-691.61%
jan 1, 2001
-2.042
-22.614
-109.93%
jan 1, 2002
15.775
+17.817
-872.33%
jan 1, 2003
5.58
-10.194
-64.62%
jan 1, 2004
3.745
-1.835
-32.89%
jan 1, 2005
-1.781
-5.525
-147.55%
jan 1, 2006
1.92
+3.7
-207.83%
jan 1, 2007
-6.052
-7.972
-415.22%
jan 1, 2008
-6.493
-0.441
7.28%
jan 1, 2009
-6.328
+0.165
-2.53%
jan 1, 2010
-3.015
+3.313
-52.36%
jan 1, 2011
2.75
+5.765
-191.23%
jan 1, 2012
3.778
+1.028
37.36%
jan 1, 2013
4.805
+1.028
27.2%
Ranking of countries by current statistics by years