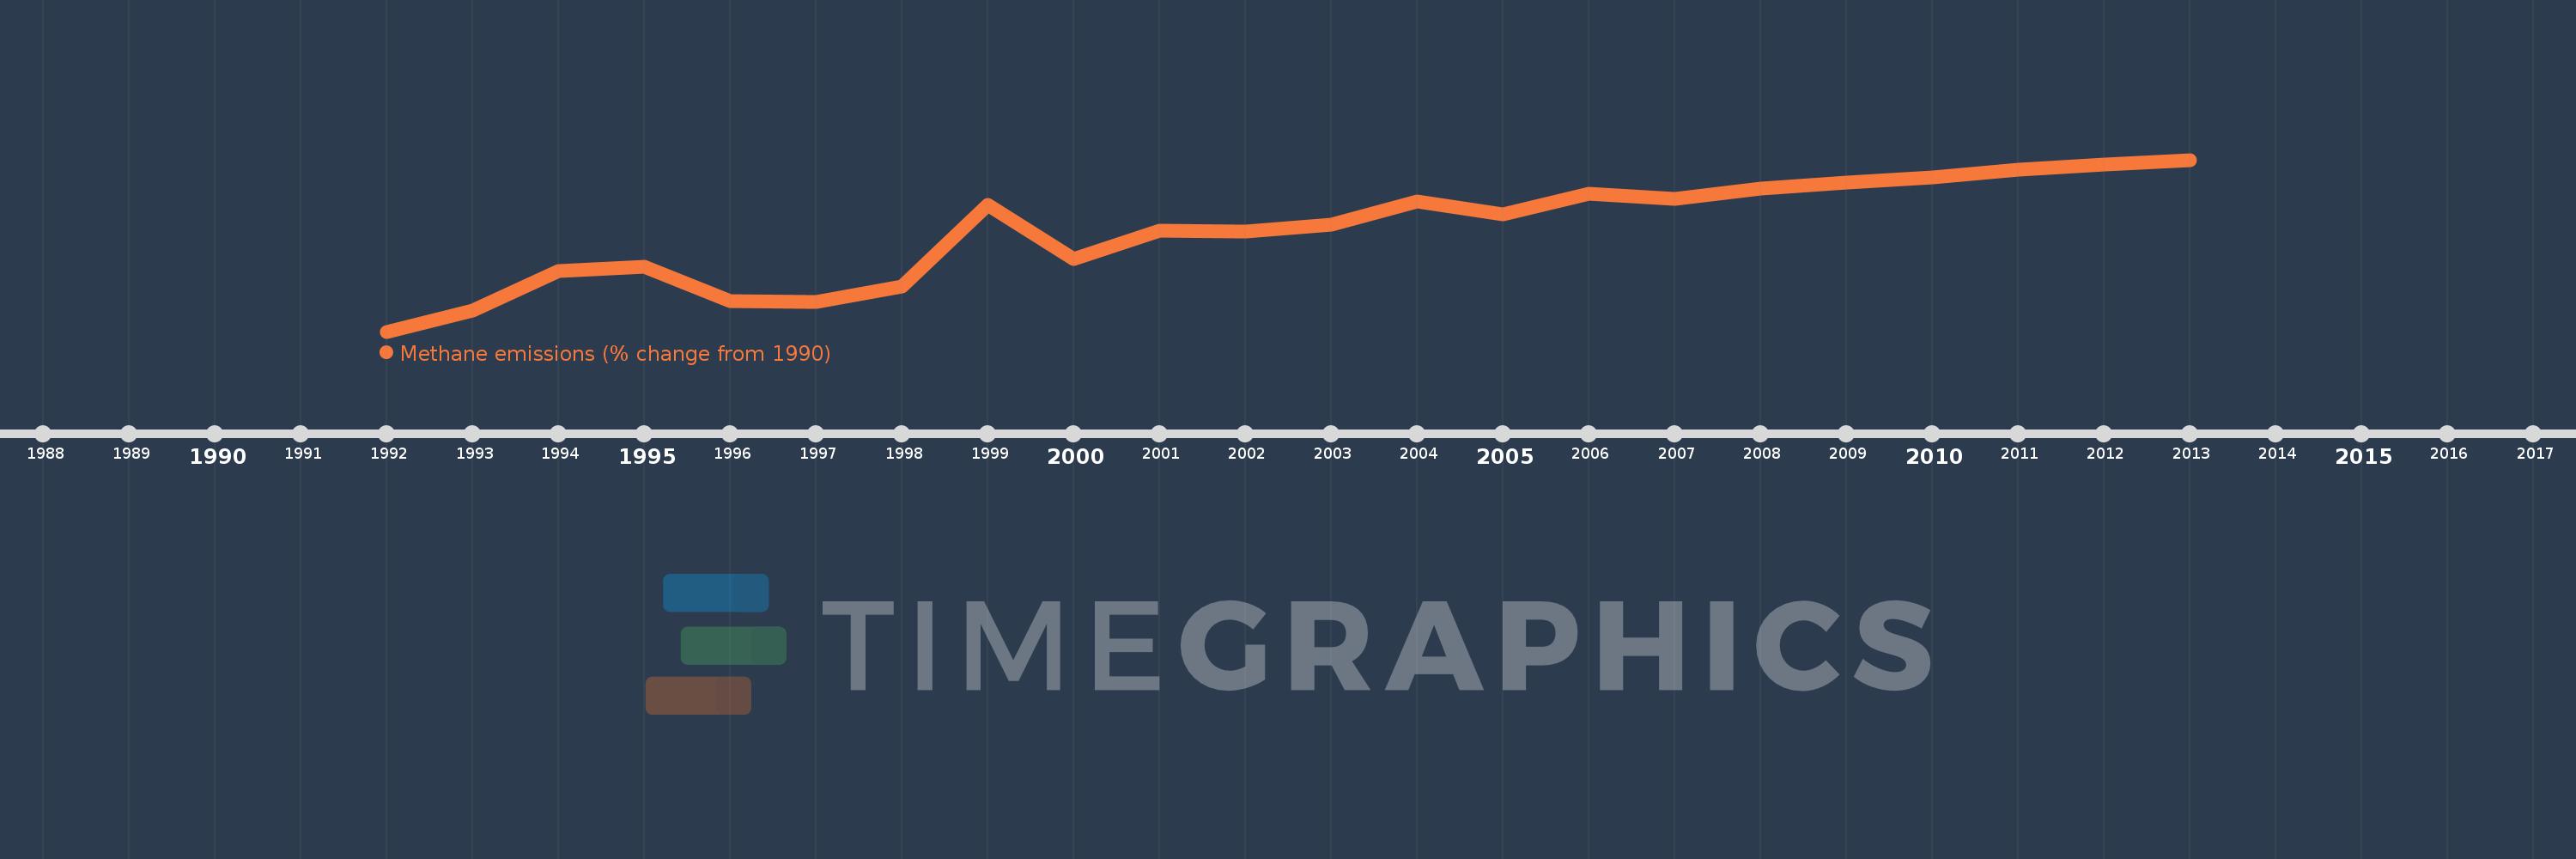
This timeline shows a graph from 1992 to 2013 of Nicaragua. No data until 1991. Number of actual observations by date: 22.
Source name:
World Development Indicators
Source organization:
World Bank staff estimates from original source: European Commission, Joint Research Centre (JRC)/Netherlands Environmental Assessment Agency (PBL). Emission Database for Global Atmospheric Research (EDGAR): http://edgar.jrc.ec.europa.eu/.
Categories, topics:
Climate Change, Environment
Last updated:
apr 23, 2017
Indicators value changes by year
Meaning:
15.681
Minimum:
-11.851
jan 1, 1992
Maximum:
34.935
jan 1, 2013
At the date of observation
Value
Absolute change
Change from the previous value
jan 1, 1992
-11.851
-11.851
0.0%
jan 1, 1993
-6.028
+5.823
-49.14%
jan 1, 1994
4.673
+10.701
-177.52%
jan 1, 1995
5.719
+1.047
22.4%
jan 1, 1996
-3.663
-9.382
-164.04%
jan 1, 1997
-3.882
-0.219
5.99%
jan 1, 1998
0.452
+4.335
-111.65%
jan 1, 1999
22.721
+22.269
4.92K%
jan 1, 2000
7.973
-14.749
-64.91%
jan 1, 2001
15.668
+7.695
96.51%
jan 1, 2002
15.299
-0.369
-2.35%
jan 1, 2003
17.312
+2.013
13.16%
jan 1, 2004
23.689
+6.376
36.83%
jan 1, 2005
20.048
-3.641
-15.37%
jan 1, 2006
25.628
+5.58
27.83%
jan 1, 2007
24.255
-1.372
-5.36%
jan 1, 2008
27.158
+2.902
11.97%
jan 1, 2009
28.839
+1.682
6.19%
jan 1, 2010
30.142
+1.302
4.52%
jan 1, 2011
32.289
+2.148
7.12%
jan 1, 2012
33.612
+1.323
4.1%
jan 1, 2013
34.935
+1.323
3.94%
Ranking of countries by current statistics by years