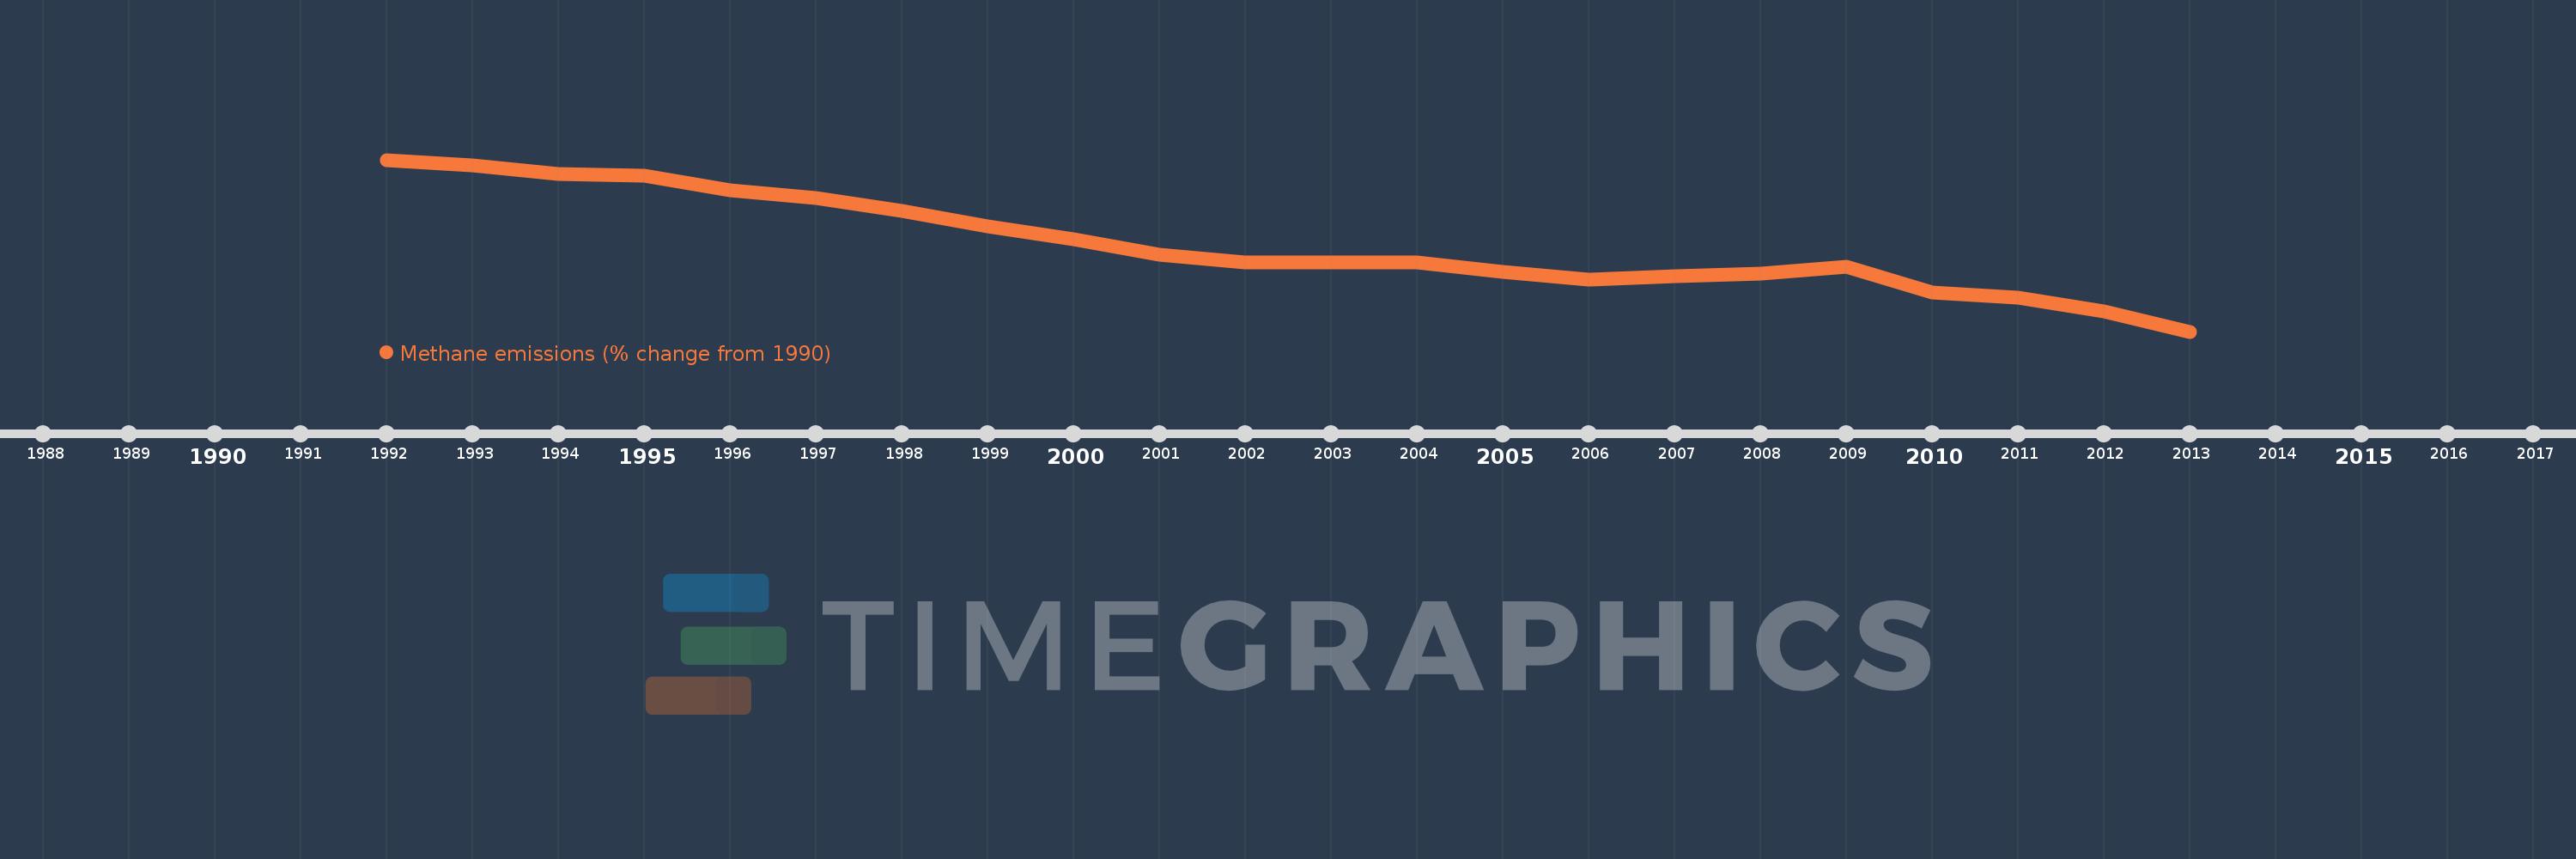
This timeline shows a graph from 1992 to 2013 of United States. No data until 1991. Number of actual observations by date: 22.
Source name:
World Development Indicators
Source organization:
World Bank staff estimates from original source: European Commission, Joint Research Centre (JRC)/Netherlands Environmental Assessment Agency (PBL). Emission Database for Global Atmospheric Research (EDGAR): http://edgar.jrc.ec.europa.eu/.
Categories, topics:
Climate Change, Environment
Last updated:
apr 23, 2017
Indicators value changes by year
Meaning:
-11.504
Minimum:
-21.615
jan 1, 2013
Maximum:
-1.617
jan 1, 1992
At the date of observation
Value
Absolute change
Change from the previous value
jan 1, 1992
-1.617
-1.617
0.0%
jan 1, 1993
-2.265
-0.648
40.04%
jan 1, 1994
-3.224
-0.959
42.33%
jan 1, 1995
-3.51
-0.286
8.88%
jan 1, 1996
-5.196
-1.686
48.03%
jan 1, 1997
-6.108
-0.912
17.55%
jan 1, 1998
-7.522
-1.415
23.16%
jan 1, 1999
-9.387
-1.865
24.8%
jan 1, 2000
-10.88
-1.493
15.9%
jan 1, 2001
-12.707
-1.827
16.8%
jan 1, 2002
-13.523
-0.815
6.42%
jan 1, 2003
-13.591
-0.068
0.5%
jan 1, 2004
-13.548
+0.043
-0.32%
jan 1, 2005
-14.667
-1.12
8.26%
jan 1, 2006
-15.564
-0.897
6.11%
jan 1, 2007
-15.192
+0.372
-2.39%
jan 1, 2008
-14.842
+0.349
-2.3%
jan 1, 2009
-14.089
+0.753
-5.07%
jan 1, 2010
-17.085
-2.996
21.26%
jan 1, 2011
-17.71
-0.625
3.66%
jan 1, 2012
-19.241
-1.531
8.64%
jan 1, 2013
-21.615
-2.374
12.34%
Ranking of countries by current statistics by years