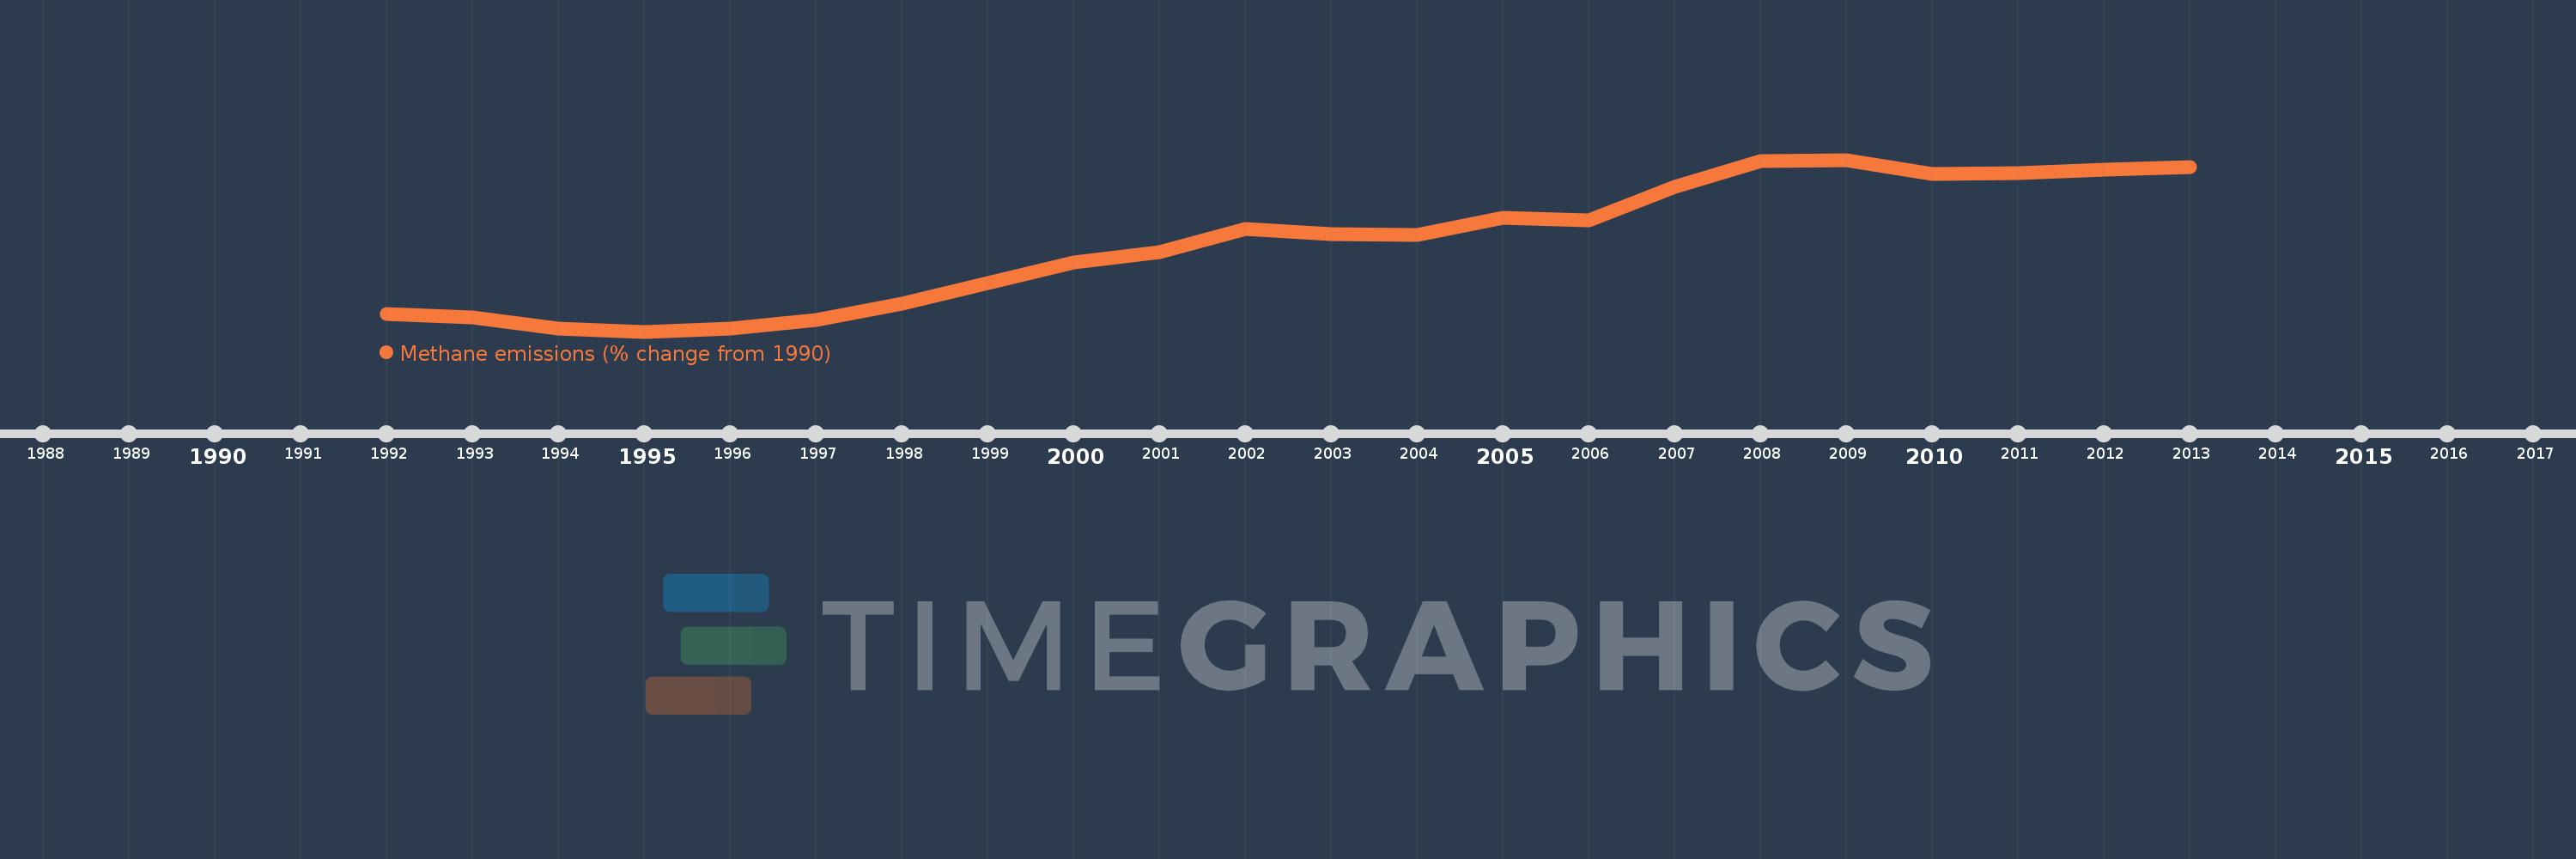
This timeline shows a graph from 1992 to 2013 of Liberia. No data until 1991. Number of actual observations by date: 22.
Source name:
World Development Indicators
Source organization:
World Bank staff estimates from original source: European Commission, Joint Research Centre (JRC)/Netherlands Environmental Assessment Agency (PBL). Emission Database for Global Atmospheric Research (EDGAR): http://edgar.jrc.ec.europa.eu/.
Categories, topics:
Climate Change, Environment
Last updated:
apr 23, 2017
Indicators value changes by year
Meaning:
34.568
Minimum:
-14.956
jan 1, 1995
Maximum:
82.218
jan 1, 2009
At the date of observation
Value
Absolute change
Change from the previous value
jan 1, 1992
-5.004
-5.004
0.0%
jan 1, 1993
-7.149
-2.144
42.85%
jan 1, 1994
-13.043
-5.895
82.46%
jan 1, 1995
-14.956
-1.913
14.67%
jan 1, 1996
-13.284
+1.672
-11.18%
jan 1, 1997
-8.36
+4.924
-37.07%
jan 1, 1998
0.944
+9.305
-111.3%
jan 1, 1999
12.577
+11.633
1.23K%
jan 1, 2000
24.06
+11.483
91.3%
jan 1, 2001
29.895
+5.835
24.25%
jan 1, 2002
43.297
+13.403
44.83%
jan 1, 2003
40.286
-3.011
-6.95%
jan 1, 2004
39.691
-0.596
-1.48%
jan 1, 2005
49.296
+9.606
24.2%
jan 1, 2006
48.069
-1.227
-2.49%
jan 1, 2007
66.904
+18.835
39.18%
jan 1, 2008
81.267
+14.364
21.47%
jan 1, 2009
82.218
+0.951
1.17%
jan 1, 2010
74.338
-7.88
-9.58%
jan 1, 2011
74.736
+0.398
0.54%
jan 1, 2012
76.483
+1.747
2.34%
jan 1, 2013
78.23
+1.747
2.28%
Ranking of countries by current statistics by years