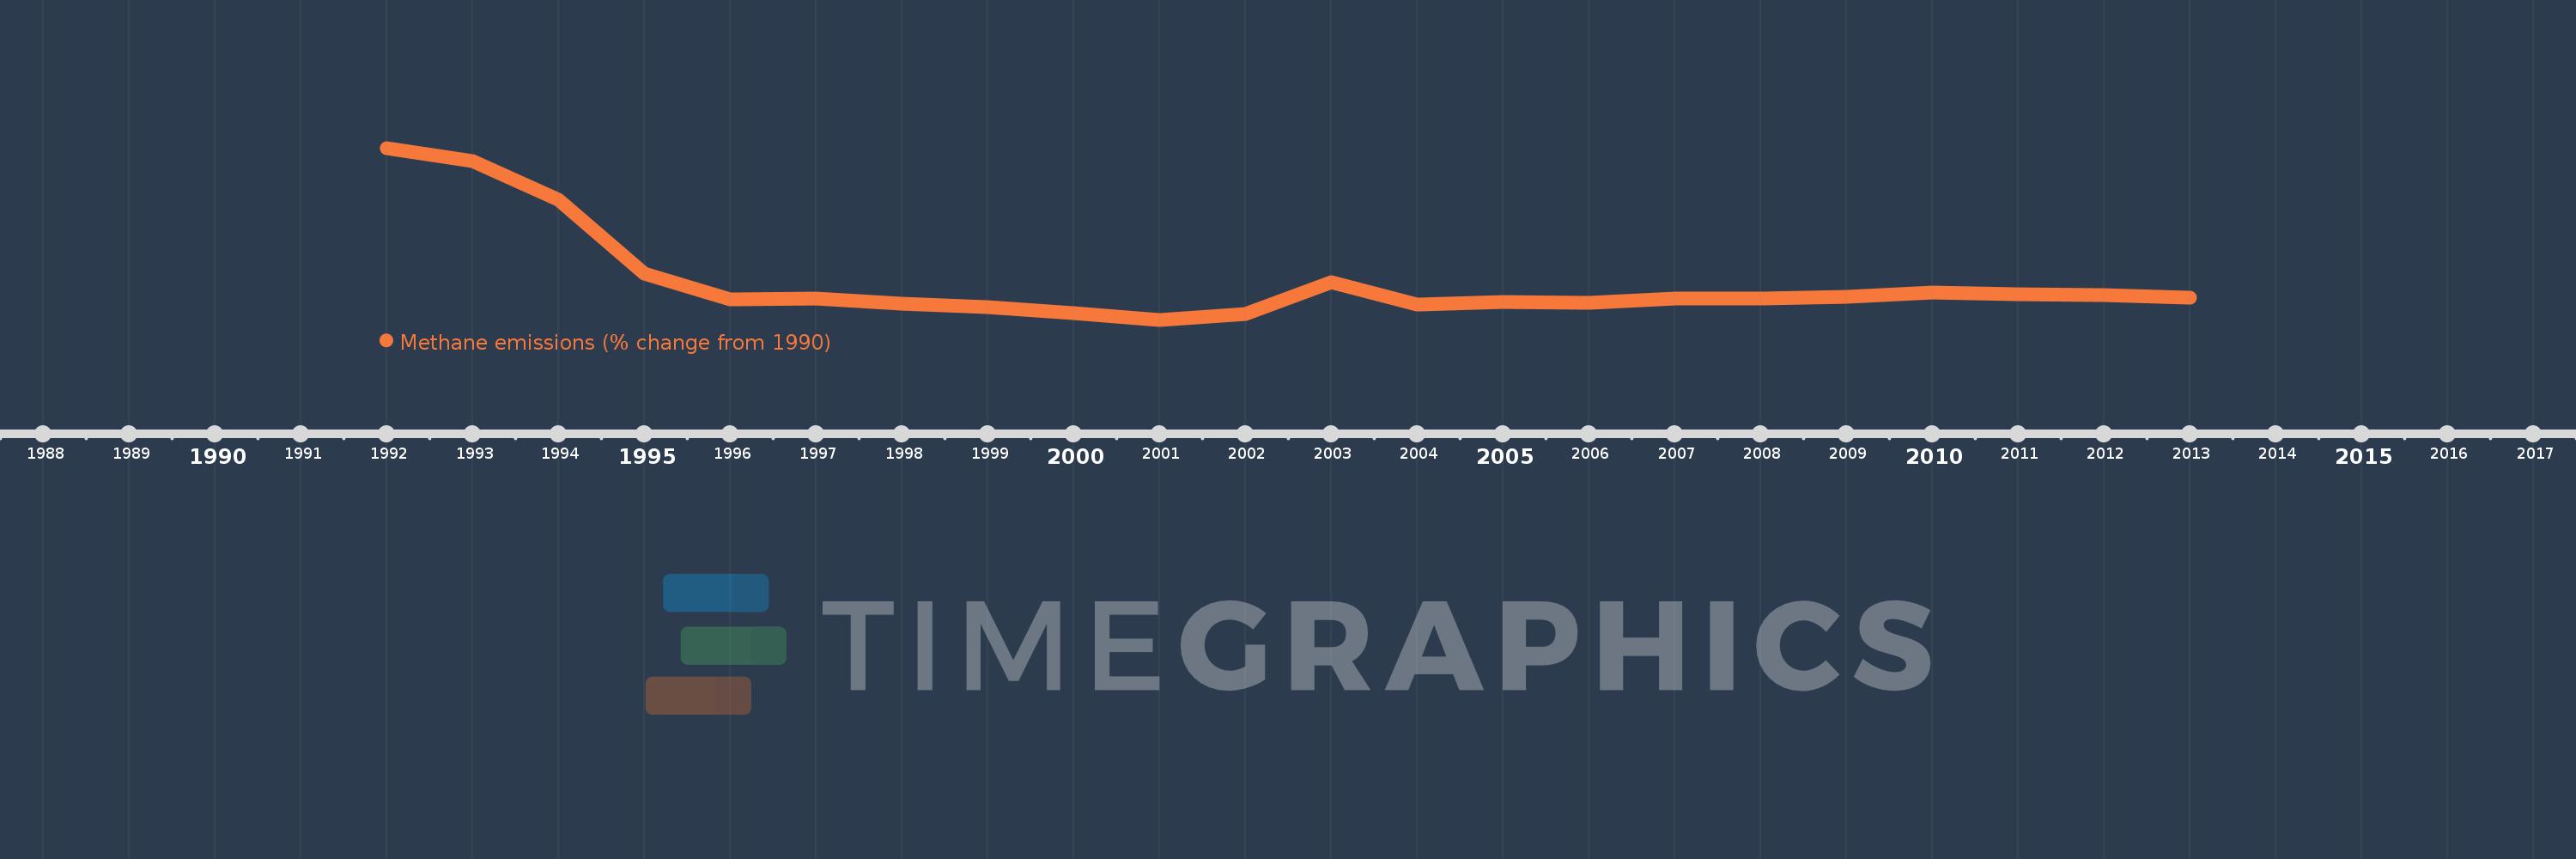
This timeline shows a graph from 1992 to 2013 of Latvia. No data until 1991. Number of actual observations by date: 22.
Source name:
World Development Indicators
Source organization:
World Bank staff estimates from original source: European Commission, Joint Research Centre (JRC)/Netherlands Environmental Assessment Agency (PBL). Emission Database for Global Atmospheric Research (EDGAR): http://edgar.jrc.ec.europa.eu/.
Categories, topics:
Climate Change, Environment
Last updated:
apr 23, 2017
Indicators value changes by year
Meaning:
-37.431
Minimum:
-48.073
jan 1, 2001
Maximum:
0.279
jan 1, 1992
At the date of observation
Value
Absolute change
Change from the previous value
jan 1, 1992
0.279
+0.279
0.0%
jan 1, 1993
-3.498
-3.777
-1.36K%
jan 1, 1994
-14.206
-10.707
306.09%
jan 1, 1995
-35.174
-20.969
147.61%
jan 1, 1996
-42.29
-7.116
20.23%
jan 1, 1997
-42.087
+0.202
-0.48%
jan 1, 1998
-43.519
-1.432
3.4%
jan 1, 1999
-44.635
-1.116
2.56%
jan 1, 2000
-46.279
-1.644
3.68%
jan 1, 2001
-48.073
-1.794
3.88%
jan 1, 2002
-46.407
+1.666
-3.47%
jan 1, 2003
-37.516
+8.891
-19.16%
jan 1, 2004
-43.825
-6.309
16.82%
jan 1, 2005
-42.956
+0.869
-1.98%
jan 1, 2006
-43.22
-0.264
0.62%
jan 1, 2007
-42.123
+1.098
-2.54%
jan 1, 2008
-42.015
+0.108
-0.26%
jan 1, 2009
-41.629
+0.386
-0.92%
jan 1, 2010
-40.389
+1.24
-2.98%
jan 1, 2011
-40.979
-0.59
1.46%
jan 1, 2012
-41.107
-0.128
0.31%
jan 1, 2013
-41.826
-0.718
1.75%
Ranking of countries by current statistics by years