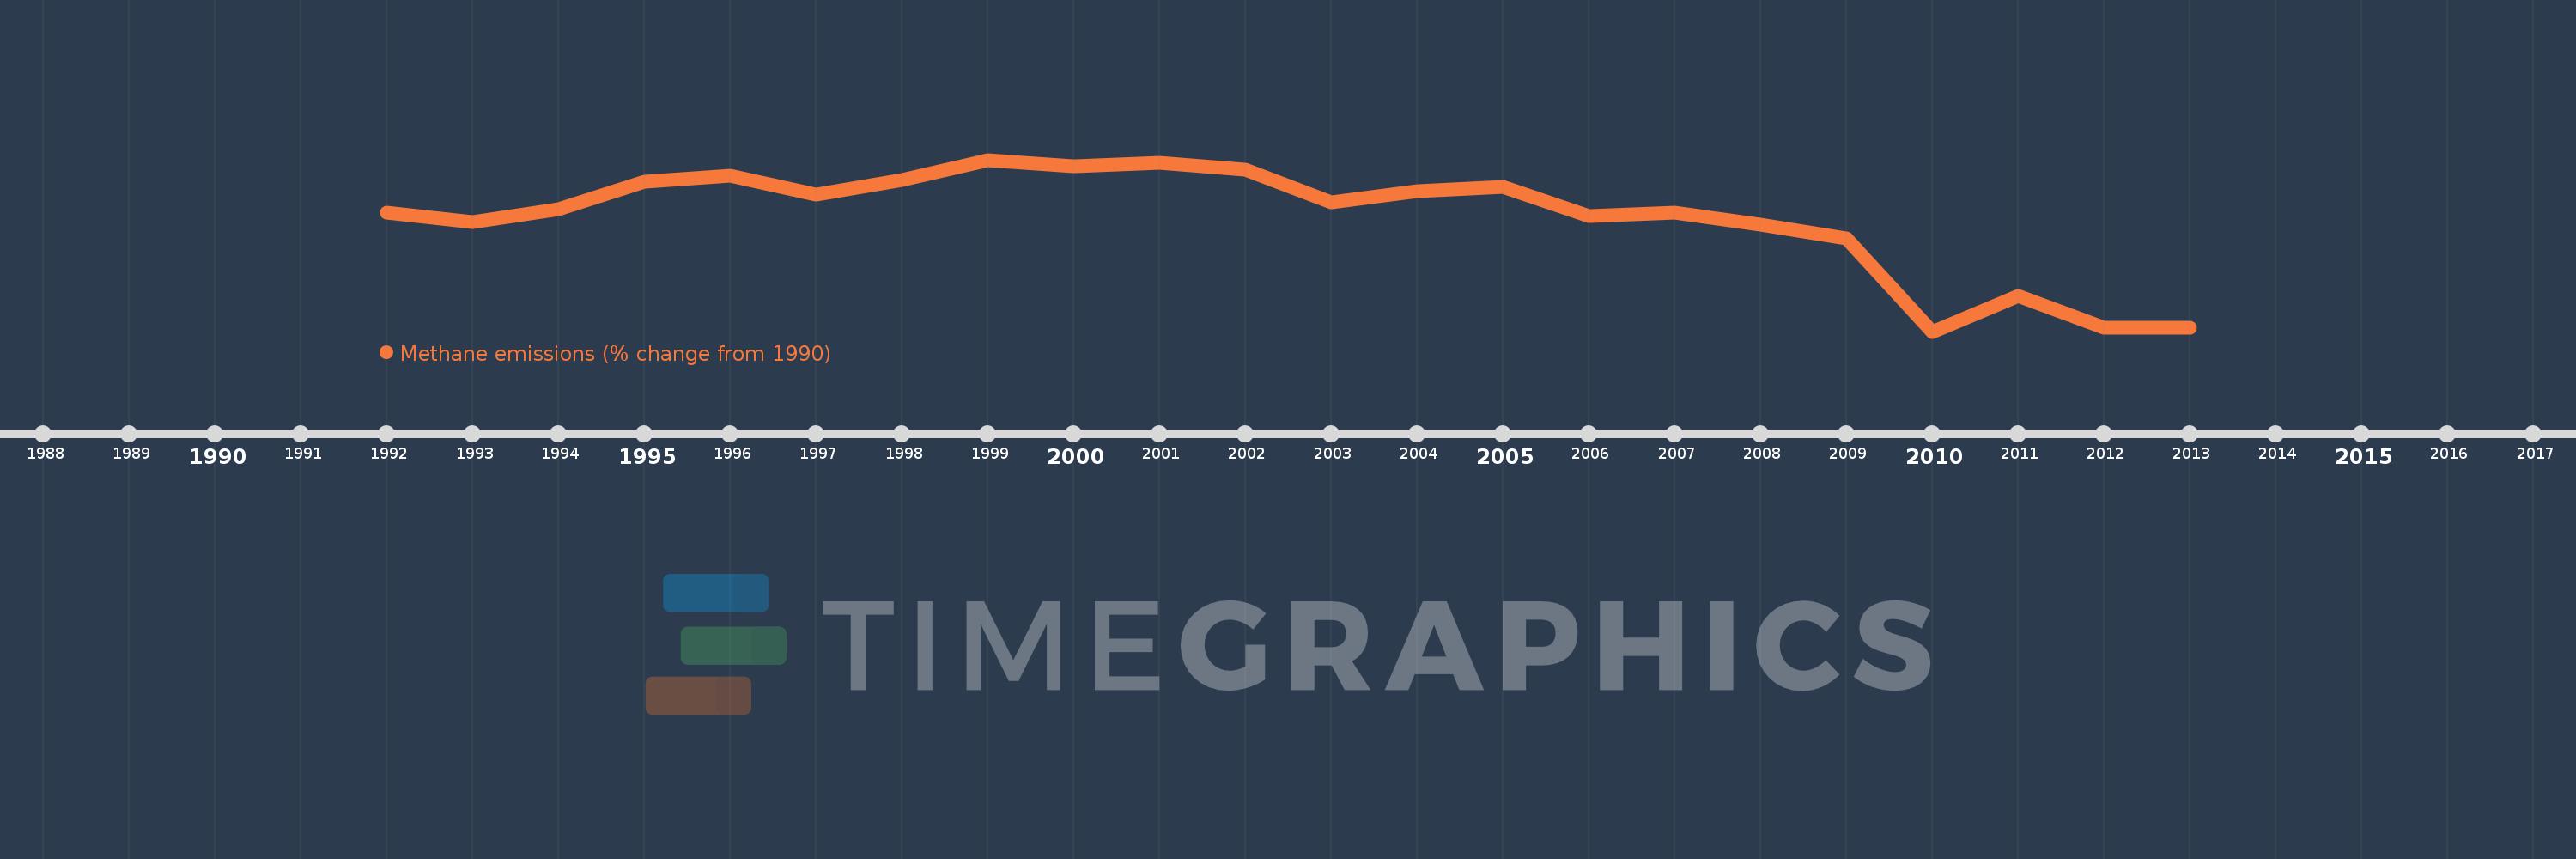
This timeline shows a graph from 1992 to 2013 of Finland. No data until 1991. Number of actual observations by date: 22.
Source name:
World Development Indicators
Source organization:
World Bank staff estimates from original source: European Commission, Joint Research Centre (JRC)/Netherlands Environmental Assessment Agency (PBL). Emission Database for Global Atmospheric Research (EDGAR): http://edgar.jrc.ec.europa.eu/.
Categories, topics:
Climate Change, Environment
Last updated:
apr 23, 2017
Indicators value changes by year
Meaning:
-3.215
Minimum:
-15.503
jan 1, 2010
Maximum:
3.031
jan 1, 1999
At the date of observation
Value
Absolute change
Change from the previous value
jan 1, 1992
-2.661
-2.661
0.0%
jan 1, 1993
-3.666
-1.005
37.77%
jan 1, 1994
-2.26
+1.407
-38.37%
jan 1, 1995
0.668
+2.928
-129.58%
jan 1, 1996
1.335
+0.666
99.7%
jan 1, 1997
-0.694
-2.028
-151.96%
jan 1, 1998
0.839
+1.533
-221.01%
jan 1, 1999
3.031
+2.192
261.18%
jan 1, 2000
2.303
-0.728
-24.02%
jan 1, 2001
2.722
+0.419
18.2%
jan 1, 2002
1.935
-0.788
-28.93%
jan 1, 2003
-1.549
-3.484
-180.05%
jan 1, 2004
-0.394
+1.154
-74.54%
jan 1, 2005
0.134
+0.528
-134.01%
jan 1, 2006
-3.066
-3.2
-2.39K%
jan 1, 2007
-2.639
+0.427
-13.94%
jan 1, 2008
-3.969
-1.331
50.43%
jan 1, 2009
-5.487
-1.518
38.23%
jan 1, 2010
-15.503
-10.016
182.54%
jan 1, 2011
-11.651
+3.852
-24.85%
jan 1, 2012
-15.101
-3.45
29.61%
jan 1, 2013
-15.067
+0.034
-0.22%
Ranking of countries by current statistics by years