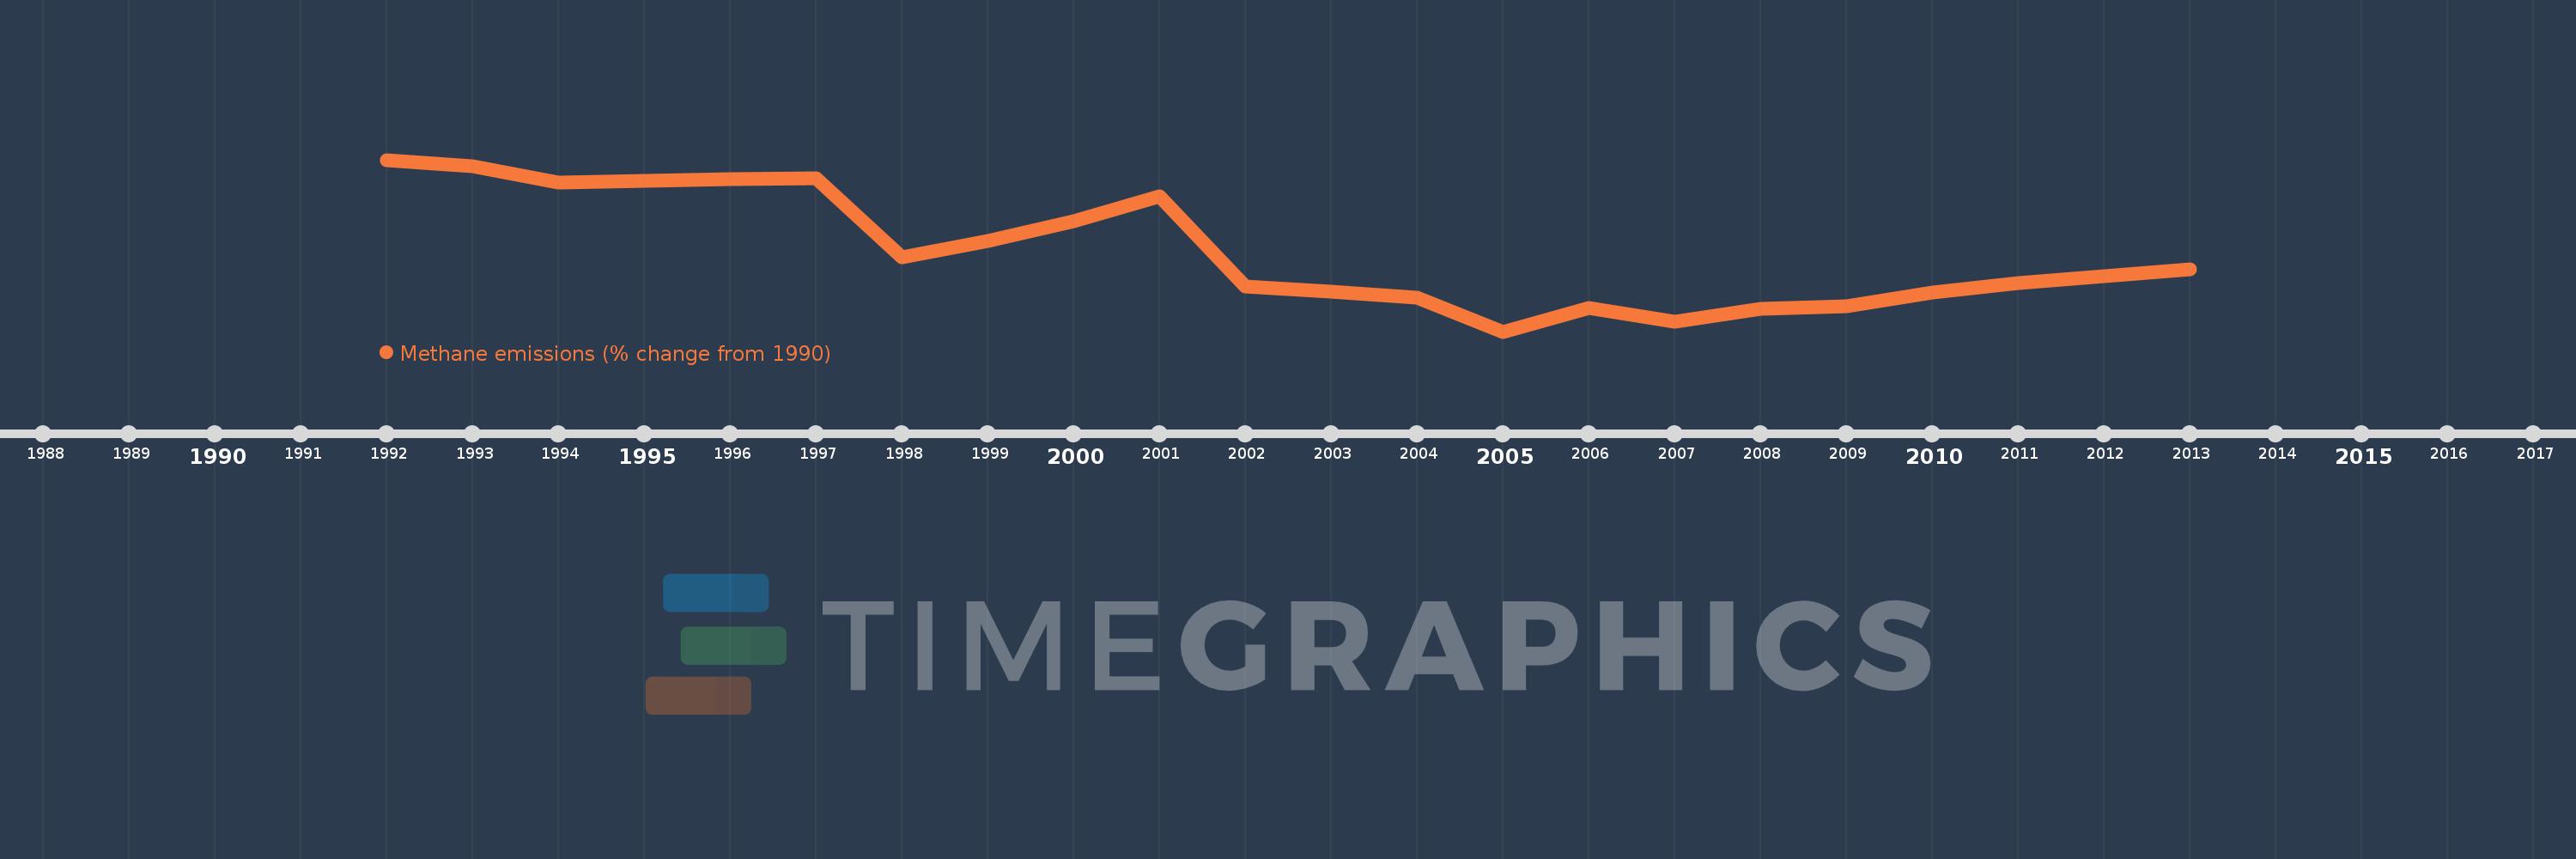
This timeline shows a graph from 1992 to 2013 of Barbados. No data until 1991. Number of actual observations by date: 22.
Source name:
World Development Indicators
Source organization:
World Bank staff estimates from original source: European Commission, Joint Research Centre (JRC)/Netherlands Environmental Assessment Agency (PBL). Emission Database for Global Atmospheric Research (EDGAR): http://edgar.jrc.ec.europa.eu/.
Categories, topics:
Climate Change, Environment
Last updated:
apr 23, 2017
Indicators value changes by year
Meaning:
-12.713
Minimum:
-22.637
jan 1, 2005
Maximum:
-1.299
jan 1, 1992
At the date of observation
Value
Absolute change
Change from the previous value
jan 1, 1992
-1.299
-1.299
0.0%
jan 1, 1993
-2.13
-0.83
63.91%
jan 1, 1994
-4.079
-1.95
91.57%
jan 1, 1995
-3.918
+0.162
-3.96%
jan 1, 1996
-3.718
+0.2
-5.1%
jan 1, 1997
-3.573
+0.145
-3.91%
jan 1, 1998
-13.383
-9.81
274.6%
jan 1, 1999
-11.4
+1.983
-14.81%
jan 1, 2000
-8.952
+2.448
-21.48%
jan 1, 2001
-5.868
+3.084
-34.45%
jan 1, 2002
-17.027
-11.159
190.14%
jan 1, 2003
-17.678
-0.651
3.82%
jan 1, 2004
-18.443
-0.765
4.33%
jan 1, 2005
-22.637
-4.194
22.74%
jan 1, 2006
-19.725
+2.912
-12.87%
jan 1, 2007
-21.441
-1.716
8.7%
jan 1, 2008
-19.856
+1.585
-7.39%
jan 1, 2009
-19.454
+0.403
-2.03%
jan 1, 2010
-17.739
+1.714
-8.81%
jan 1, 2011
-16.62
+1.12
-6.31%
jan 1, 2012
-15.786
+0.834
-5.02%
jan 1, 2013
-14.952
+0.834
-5.28%
Ranking of countries by current statistics by years