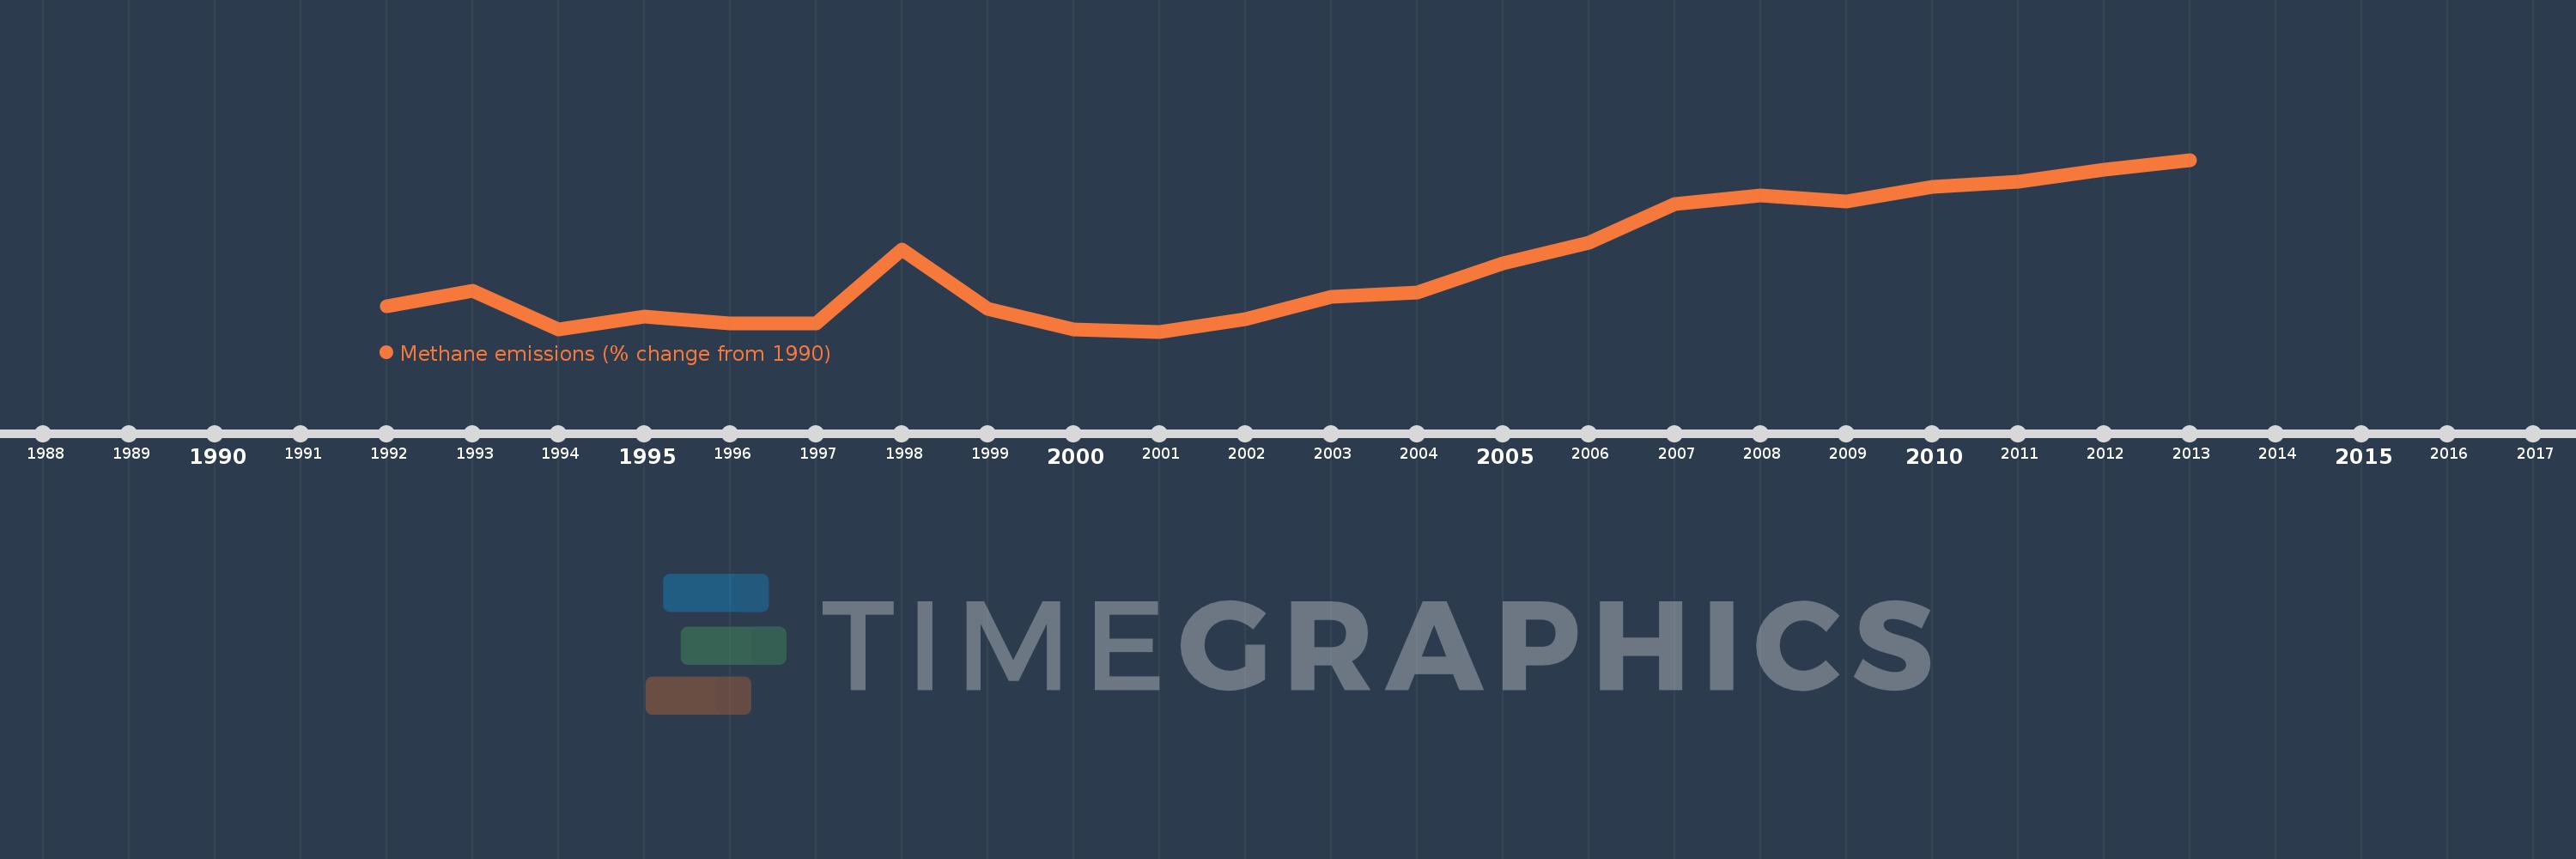
This timeline shows a graph from 1992 to 2013 of World. No data until 1991. Number of actual observations by date: 22.
Source name:
World Development Indicators
Source organization:
World Bank staff estimates from original source: European Commission, Joint Research Centre (JRC)/Netherlands Environmental Assessment Agency (PBL). Emission Database for Global Atmospheric Research (EDGAR): http://edgar.jrc.ec.europa.eu/.
Categories, topics:
Climate Change, Environment
Last updated:
apr 23, 2017
Indicators value changes by year
Meaning:
6.151
Minimum:
-2.815
jan 1, 2001
Maximum:
20.18
jan 1, 2013
At the date of observation
Value
Absolute change
Change from the previous value
jan 1, 1992
0.602
+0.602
0.0%
jan 1, 1993
2.671
+2.069
343.47%
jan 1, 1994
-2.478
-5.149
-192.74%
jan 1, 1995
-0.762
+1.716
-69.26%
jan 1, 1996
-1.674
-0.913
119.83%
jan 1, 1997
-1.751
-0.076
4.57%
jan 1, 1998
8.14
+9.891
-564.92%
jan 1, 1999
0.191
-7.949
-97.66%
jan 1, 2000
-2.478
-2.669
-1.4K%
jan 1, 2001
-2.815
-0.337
13.61%
jan 1, 2002
-1.151
+1.664
-59.12%
jan 1, 2003
1.82
+2.971
-258.12%
jan 1, 2004
2.45
+0.63
34.64%
jan 1, 2005
6.295
+3.845
156.9%
jan 1, 2006
9.111
+2.816
44.73%
jan 1, 2007
14.24
+5.129
56.3%
jan 1, 2008
15.432
+1.192
8.37%
jan 1, 2009
14.618
-0.814
-5.27%
jan 1, 2010
16.594
+1.976
13.52%
jan 1, 2011
17.207
+0.613
3.69%
jan 1, 2012
18.875
+1.669
9.7%
jan 1, 2013
20.18
+1.305
6.91%
Ranking of countries by current statistics by years