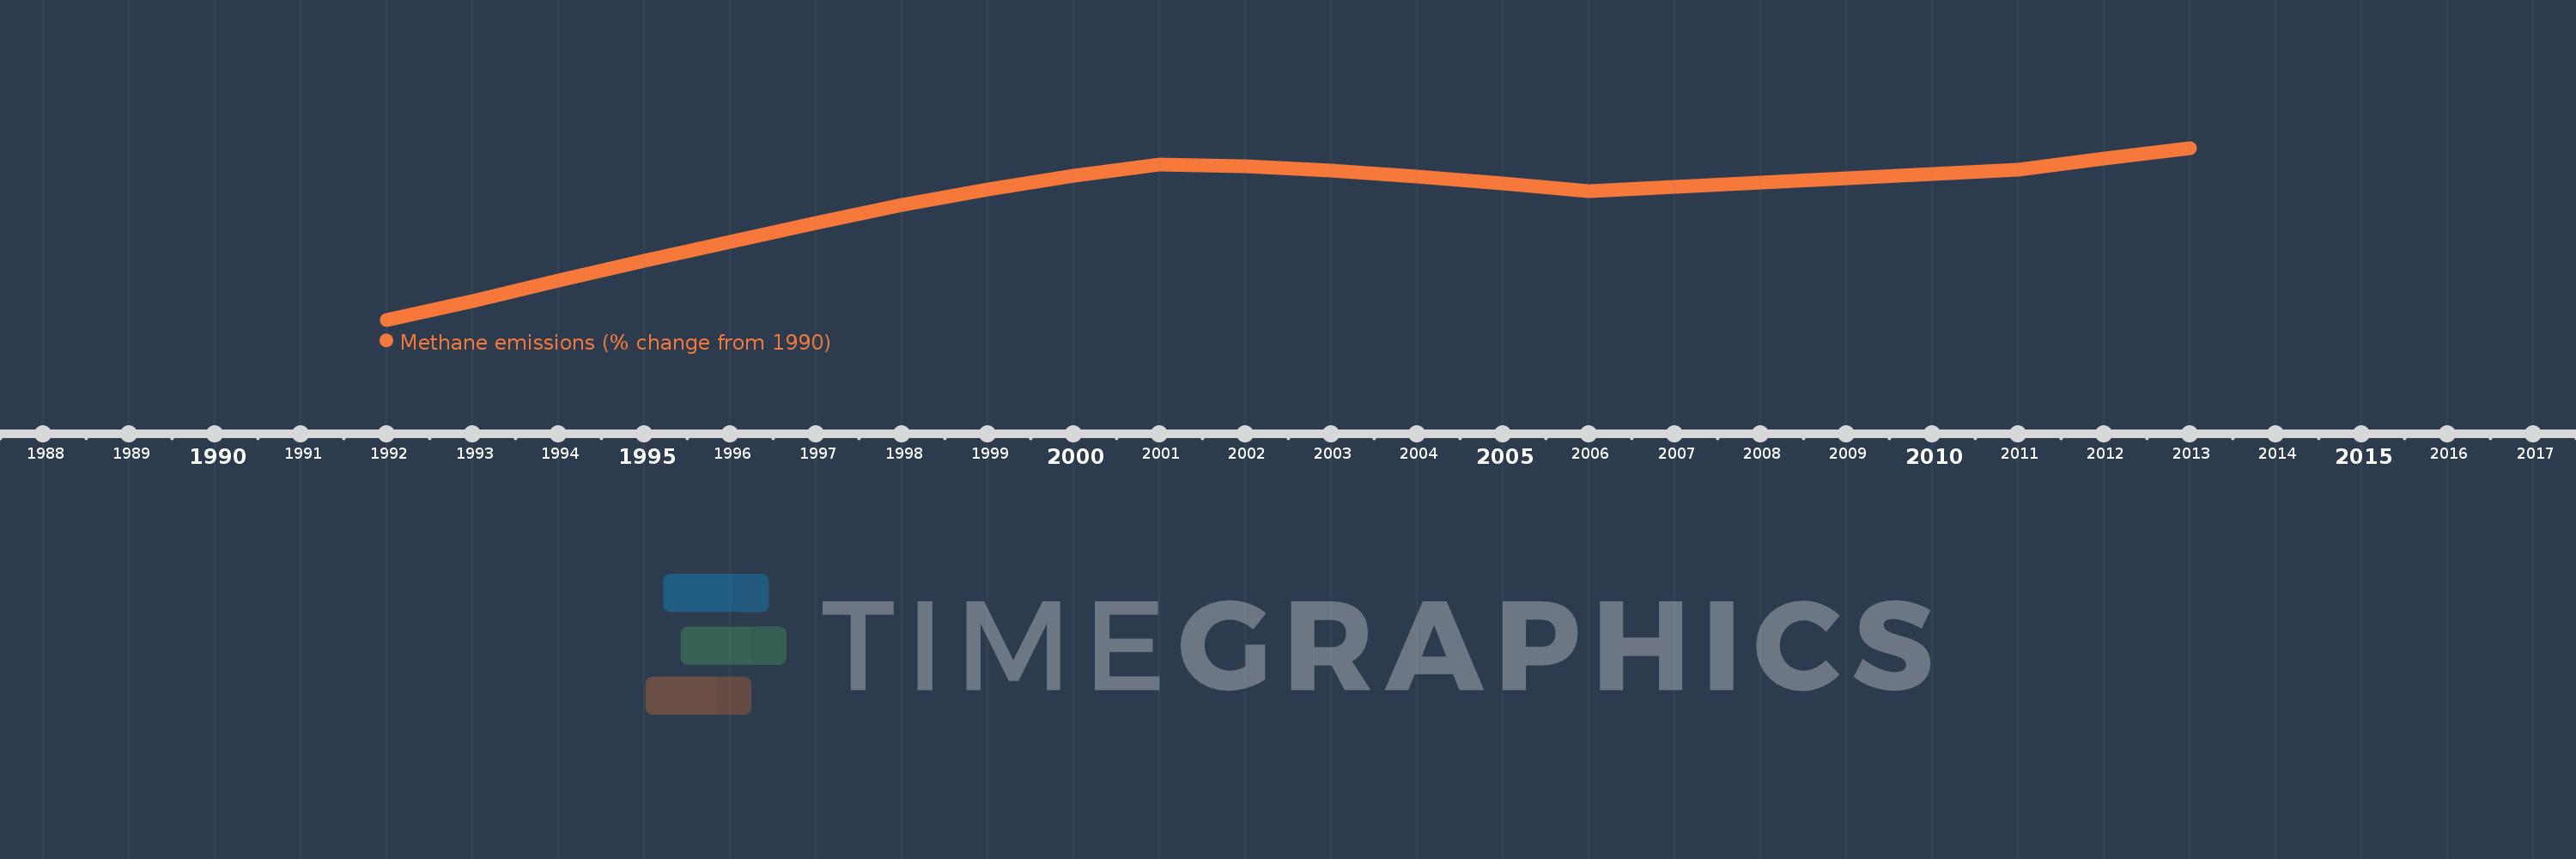
This timeline shows a graph from 1992 to 2013 of Palau. No data until 1991. Number of actual observations by date: 22.
Source name:
World Development Indicators
Source organization:
World Bank staff estimates from original source: European Commission, Joint Research Centre (JRC)/Netherlands Environmental Assessment Agency (PBL). Emission Database for Global Atmospheric Research (EDGAR): http://edgar.jrc.ec.europa.eu/.
Categories, topics:
Climate Change, Environment
Last updated:
apr 23, 2017
Indicators value changes by year
Meaning:
14.242
Minimum:
1.627
jan 1, 1992
Maximum:
20.059
jan 1, 2013
At the date of observation
Value
Absolute change
Change from the previous value
jan 1, 1992
1.627
+1.627
0.0%
jan 1, 1993
3.61
+1.983
121.85%
jan 1, 1994
5.799
+2.189
60.65%
jan 1, 1995
7.975
+2.176
37.52%
jan 1, 1996
9.976
+2.001
25.09%
jan 1, 1997
12.05
+2.074
20.79%
jan 1, 1998
13.952
+1.901
15.78%
jan 1, 1999
15.636
+1.684
12.07%
jan 1, 2000
17.075
+1.439
9.2%
jan 1, 2001
18.249
+1.174
6.87%
jan 1, 2002
18.113
-0.136
-0.74%
jan 1, 2003
17.668
-0.445
-2.46%
jan 1, 2004
17.009
-0.659
-3.73%
jan 1, 2005
16.241
-0.768
-4.51%
jan 1, 2006
15.448
-0.793
-4.88%
jan 1, 2007
15.879
+0.431
2.79%
jan 1, 2008
16.307
+0.428
2.69%
jan 1, 2009
16.802
+0.495
3.04%
jan 1, 2010
17.253
+0.451
2.68%
jan 1, 2011
17.705
+0.452
2.62%
jan 1, 2012
18.882
+1.177
6.65%
jan 1, 2013
20.059
+1.177
6.23%
Ranking of countries by current statistics by years